Everyone knows that SQL Developer has a PL/SQL debugger – check!
Everyone also knows that it’s only setup for debugging standalone PL/SQL objects like Functions, Procedures, and Packages, right? – NO! SQL Developer can also debug your Stored Java Procedures AND it can debug your standalone PLSQL blocks. These bits of PLSQL which do not live in the database are also known as ‘Anonymous Blocks.’
Anonymous PL/SQL blocks can be submitted to interactive tools such as SQL*Plus and Enterprise Manager, or embedded in an Oracle Precompiler or OCI program. At run time, the program sends these blocks to the Oracle database, where they are compiled and executed.
Here’s an example of something you might want help debugging:
DECLARE
 x NUMBER := 0;
BEGIN
 DBMS_OUTPUT.Put(SYSDATE || ' ' || SYSTIMESTAMP);
 FOR Stuff IN 1..100
 LOOP
  DBMS_OUTPUT.Put_Line('Stuff is equal to ' || Stuff || '.');
  x := Stuff;
END LOOP;
END;
 /
With the power of remote debugging and unshared worksheets, we are going to be able to debug this ANON block!
The trick – we need to create a dummy stored procedure and call it in our ANON block. Then we’re going to create an unshared worksheet and execute the script from there while the SQL Developer session is listening for remote debug connections.
We step through the dummy procedure, and this takes OUT to our calling ANON block. Then we can use watches, breakpoints, and all that fancy debugger stuff!
First things first, create this dummy procedure –
CREATE OR REPLACE
PROCEDURE do_nothing IS
BEGIN
 NULL;
END;
Then mouse-right-click on your Connection and select ‘Remote Debug.’ For an in-depth post on how to use the remote debugger, check out Barry’s excellent post on the subject.
Open an unshared worksheet using Ctrl+Shift+N. This gives us a dedicated connection for our worksheet and any scripts or commands executed in it.
Paste in your ANON block you want to debug.
Add in a call to the dummy procedure above to the first line of your BEGIN block like so
BEGIN
 do_nothing();
...
Then we need to setup the machine for remote debug for the session we have listening – basically we connect to SQL Developer. You can do that via a Environment Variable, or you can just add this line to your script –
CALL DBMS_DEBUG_JDWP.CONNECT_TCP( 'localhost', '4000' );
Where ‘localhost’ is the machine where SQL Developer is running and ‘4000’ is the port you started the debug listener on.
Or, Using the Environment Variable
ORA_DEBUG_JDWP=host=mypc;port= 1234
The obvious advantage here is that none of your source code needs altered.
Ok, with that all set, now just RUN the script.
Once the PL/SQL call is made, the debugger will be invoked. You’ll end up in the DO_NOTHING() object.

If you step out to the ANON block, we’ll end up in the script that’s used to call the procedure – which is the script you want to debug.

You can now step through the block, using watches and breakpoints as expected.
I’m guessing your scripts are going to be a bit more complicated than mine, but this serves as a decent example to get you started.
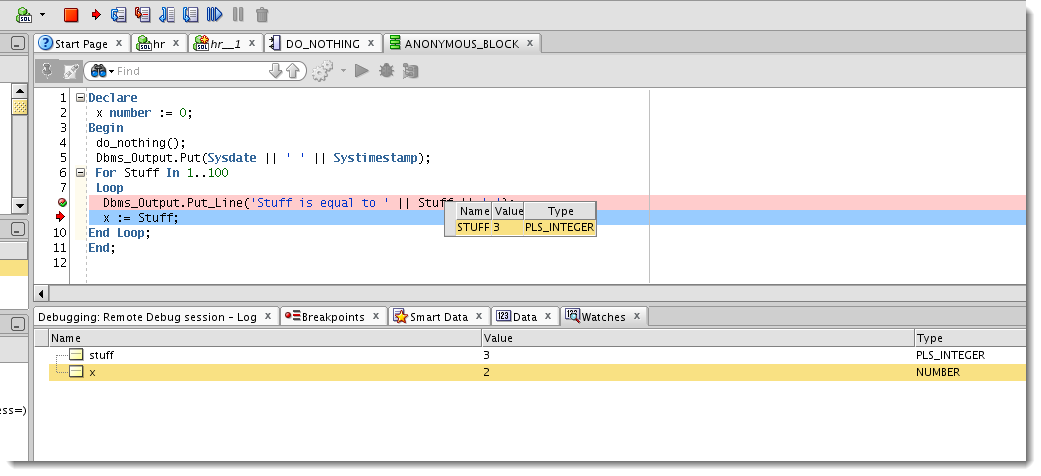
Here’s a screenshot of a watch and breakpoint defined in the anon block being debugged:

For giggles, I created a breakpoint with a passcount of 90 for the FOR LOOP to see if it works. And of course it does 🙂


21 Comments
I inadvertently clicked the “don’t show dialog box” in the Remote Debugger dialog and cannot see where to turn it back on. So now I cannot set the port nor the host address. Any clues? I’m using version 19.2.0.206.2117. I looked through the preferences but did not see anything for remote debugging.
Thanks.
I found the file that controls the dialog showing up.. It’s .oracle_javatools_msgdlg.properties in windows it under the AppData\Roaming\SQL Developer\system[insert your version here]\o.ide.[some other version number here]\.oracle_javatools_msgdlg.properties file Toggle it form false to true or true to false then I restarted sqldeveloper for it to take effect.
I could not find it in the app itself though …
Upon further review I noticed that if I just deleted the file altogether then restarting SQL Developer it had the same affect (i.e., the JPDA dialog box prompt would return)
So either delete the file or toggle the value from true to false then restart.
Unfortunately I didn’t get this to work.
A warning to those who create an environment variable ORA_DEBUG_JDWP: the presence of this environment variable appears to cause (silent) failures of attempts to install Oracle XE 11g.
Did you try David Donovan’s solution (below)?
Hi Jeff,
I’m trying to remote debug a stored procedure and the debugger just blows past all of my breakpoints. The connection is fine – I can see the debugger connect and then disconnect, but the breakpoint I have set in between the connect and disconnect commands (using dbms_debug_jdwp) is completely ignored.
The request is coming from a web application. That application uses a single web user to handle all transactions from the application to the db. The privileges for that user are limited as they should be. When I have the remote debugger running in sqldeveloper, I’m logged in as myself so that I can actually see and edit the procedure (which is owned by another higher-privileged user, other than myself).
Is the debugger ignoring the breakpoints I’m setting because the request is coming in as the web user? How can I cause any breakpoint that I set to be hit regardless of who is making the request?
Thanks,
Mehr
Two things:
In either of these cases, the breakpoints are ignored.
When you debug it locally, is said breakpoint honored?
Hi Jeff,
Well, I got things working and am honestly not sure how. It may have been that my original breakpoint was not on an executable line of code, as you suggested, but the line of code I had chosen originally was this:
queryCtx := DBMS_XMLQuery.newContext
(‘select * from bigdata1.data_hash_view where dbid = ‘||ds_id);
Is there any reason why that line of code wouldn’t catch a breakpoint?
Anyway, thanks for the help.
Best,
Mehr
I have found the easiest way to do anon code debugging is simply:
1) Go into: Preferences -> Debugger
2) Under ‘Start Debugging Option’ choose ‘Step Into’
3) Open the script you want to anonymously debug
4) Right click and choose ‘Debug’ from the popup context menu (CTRL+SHIFT+F10)
Voila, now the debugger should be halted at the 1st line of your code. You can now insert breakpoints anywhere and use normal debugging stuff.
—–
Now my only question is, how to view the real time debugging contents of PL/SQL collections as the individual records are obfuscated.
Thanks David, this is really helpful!
The article is really excellent. However I am just unable to invoke or insert a breakpoint in the above anonymous procedure. The version of SQL Developer is: Version 4.0.3.16
I have followed the steps listed by you Jeff and also Barry McGillin’s article yet no success. Is there any way to invoke the breakpoint and have it inserted into the anonymoys block as you have depicted above (pinkish color or to that matter invoking a watch window). Please gelp.
Sandeep
I had to add ALTER SESSION SET PLSQL_DEBUG=TRUE, otherwise I couldn’t step into anonymous block.
Here is the full content of my unshared sql worksheet
ALTER SESSION SET PLSQL_DEBUG=TRUE
CALL DBMS_DEBUG_JDWP.CONNECT_TCP( ‘localhost’, ‘4000’ );
Declare
x number := 0;
Begin
Dbms_Output.Put(Sysdate || ‘ ‘ || Systimestamp);
For Stuff In 1..100
Loop
Dbms_Output.Put_Line(‘Stuff is equal to ‘ || Stuff || ‘.’);
x := Stuff;
End Loop;
End;
/
Thanks!
Your comment is awaiting moderation.
Hi, could you help please, I’m having some trouble.. let me try to explain..
I could start remote debuging with sqldeveloper calling it from a anonymous block from my java program, it starts perfectly debugging the do_nothing procedure from sqldeveloper and I can see on the stack two items (do_nothing an AnonymousBlock), the debugger steps into others functions declared in my anonymous block perfectly but… I cant debug my anonymous block, and when I double click its from stack’s list, it does not show my code..
where I am failing?.
sorry I forgot to mark to receive someone replies in my last post
Great article. Just like to add a small information. Before starting the first debugging run, add a breakpoint into the procedure “do_nothing”. On my system (SQL-Developer 3.2.2) this seemed to be another way to get the anonymous_block window. And from there adding further breakpoints was obvious.
There is “debug” context menu item in SQL worksheet. However, there is no way to set breakpoints in SQLWorksheet. If you have Preferences->Debug->”Step Into” then the debuggin process would open PL/SQL editor for anonymous block with execution stopped at the very first line, where you can set breakpoints and do normal debugging.
Thanks Tegiri! I totally overlooked that Context menu item!
So we need to figure out why the ‘remote debug’ click isn’t working. That’s a ‘do not pass go’ type of problem. Can you follow my directions here for capturing logging info and email that to me? [email protected]
Thanks for trying this technique and taking the time to respond with your feedback – we’ll get it working!
Hey Jeff,
Well the good news is a restart of SQL Developer seemed to fix the problem with the popup. I executed the anon script in an unshared worksheet with the dbms_debug call. I tried to make the dbms_debug call in another unshared worksheet as well but kept getting errors. I was most interested in running anon scripts the most from this article, as of right now I start a debug on a procedure and replace the autogenerated script with my anonymous script.
I guess a picture might help:
http://i18.photobucket.com/albums/b116/dtdono0/Oracle/oracle_debug001.png
You only use localhost if you’re database is on the same machine as SQL Developer. Replace localhost with the IP or network name of the machine where you have SQL Developer installed.
Jeff, your article seems a little unclear.
– I pasted your anon script,
– created the dummy proc
– right clicked on the db connection, clicked remote debug…no window for pops up
– and obviously the DBMS_DEBUG_JDWP.CONNECT_TCP fails afterwards.
My sandbox environment is a Win7 host running oracle 11g on a windows server 2008 guest VM via VirtualBox. SQL Developer is v3.1.07 which I am running from the host. I don’t understand why the window does not appear for remote debug though.
Maybe I should try running SQL Developer on the VM to see if that is causing the issue.