Want to monitor or browse the sessions running on your database? You could query v or gv$session and get an idea of what’s happening. But often you want and need to join into waits, locks, performance data, plans, etc. to get a full picture of what your users and applications are doing in the database.
Enter the Tools – Monitor Sessions… screen.
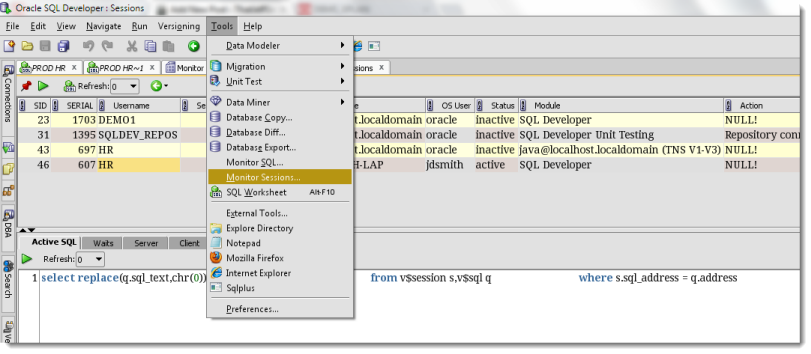
This is actually a Master/Detail report! I know, shocking – right? You can find the same screen in SQL Developer under the Reports – Database Administration – Sessions. Folks had a hard time finding that screen so we copied this particular report up to the Tools menu.
Is it perfect? Not quite, but what software solution is? Fortunately since it’s a report, we can customize it to fit your needs. And by ‘we,’ I mean ‘you.’ Let’s work through a quick example.
My Monitor Sessions Enhancement Requests
- No v$session_longops – how much time is left on my backup or index creation?
- No execution plan for Active SQL
- No bind variables
- It queries v$ instead of gv$
- SQL is hard to read, no carriage returns, bunch of extra spaces
How to Customize Monitor Sessions
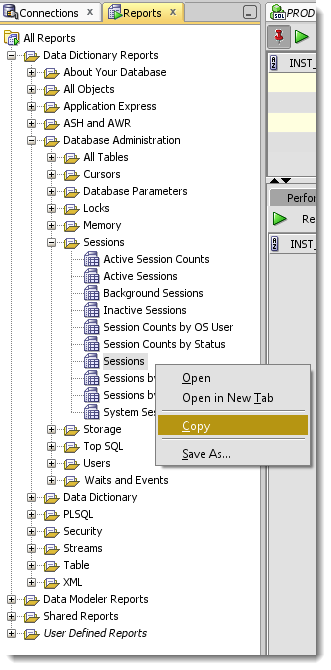
To get started you need to find the report and copy and paste it under the ‘User Defined Reports’ section.
Once the report is in the User section, it’s yours to control. That means you can edit it to your heart’s delight. Now, before you spend a lot of time writing your own queries, be sure to check out the other Sessions reports. The ‘Active Sessions’ gives me most of what I was wanting above. It queries the GV$ view so I can see sessions across my RAC instance, it includes the plan, bind variables, and v$session_longops. So if that satisfies your needs, then feel free to stop now.
But if you want a combination of both Sessions and Active Sessions, then you’ll need to copy and edit one or the other.
I chose to start with Active Sessions and work in what I liked from Sessions and add my own stuff too.
What I Did
- modified the master WHERE to include ALL sessions, not just ACTIVE ones
- added SID and USERNAME to the master SELECT
- renamed the Active SQL child report to Performance & Query
- renamed the Explain Plan child report to V$SQL_PLAN
- added a new child report – XPLAN
- added a new child report – SQL
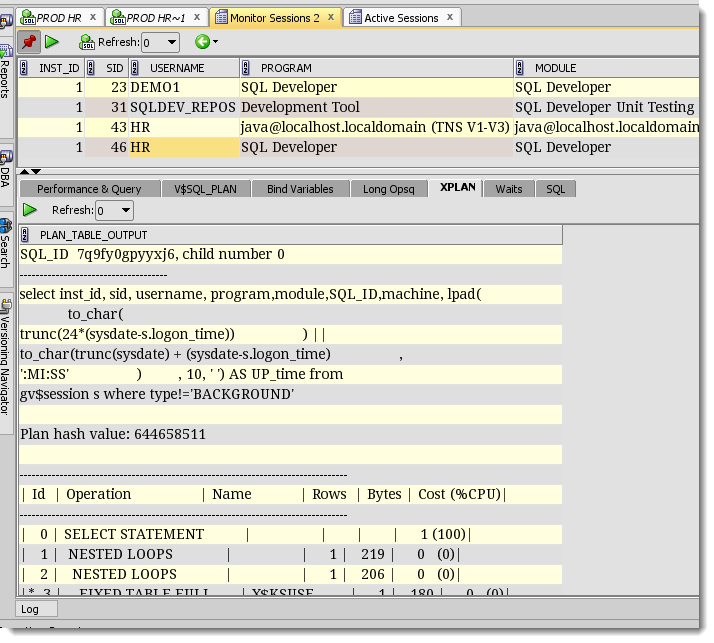
I didn’t do anything TOO crazy. For the XPLAN report, I wanted to see the FULL DBMS_XPLAN output for the specified SQL_ID. So I wrote this:
SELECT * FROM TABLE(DBMS_XPLAN.DISPLAY_CURSOR((:SQL_ID)))
Remember, use the :COL_NAME syntax to tie the Child Report to the active data selected in the Master Report. So when I am looking at a session and I click on XPLAN, it automatically takes the SQL_ID from the master report and feeds it to the query in the child report.
The result looks like this:
I did a little crazy work for the SQL child report though. Something that drives me nuts is the unformatted SQL in the Sessions and Active Sessions reports. Looks a little something like this:

What I want to see is some text that’s a bit easier to read. Of course I could copy it out to the worksheet and format it, but remember – I’m lazy. So instead I spent about 40 minutes figuring out how to get those spaces replaced with something like a CR LF pair so it would display properly in my report.
Instead of boring you with the entire trial and error process, I’ll just show you the finished product and then share the code so you can borrow it if you’d like.
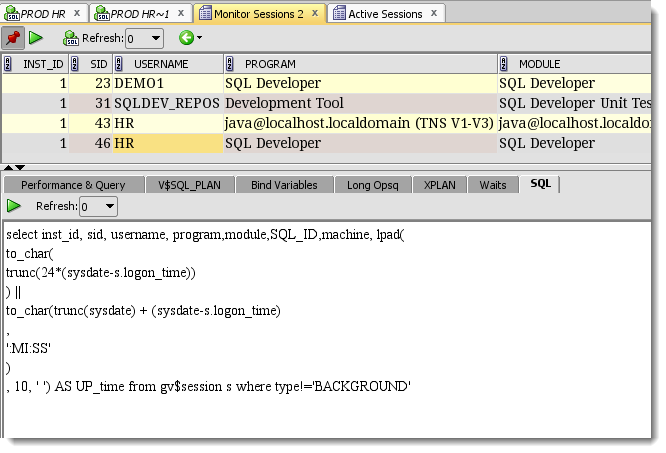
This is an DBMS_OUTPUT (HTML) report. I can run a anonymous PLSQL block and write to DBMS_OUTPUT. If I include HTML tags, SQL Developer will render them in the report. I used this trick recently in a blog post for @martinberx.
So I queried the text INTO a character variable using a regular expression to replace multiple space characters with a single BR HTML tag, then printed that variable using a call to DBMS_OUTPUT.PUT_LINE(). Here’s the code:
DECLARE
 code CLOB;

BEGIN
SELECT regexp_replace(sql_text, '( ){2,}', '<br>') INTO code
    FROM gv$sql
    WHERE sql_id = :SQL_ID;


dbms_output.put_line(code);
END;
Remember you have to set the Child Report type to ‘PLSQL DBMS Output.’
Now, some caveats. Please don’t blindly copy and paste my code. In other words, please test to make sure it does what I say it does. I’m grabbing sql_text, which is ONLY the first 1,000 characters of the query. You could query SQL_FULLTEXT instead.
If you build something that you think is extra-awesome and want to share it, you don’t need to start your own blog. Instead, you can submit it to the SQL Developer Exchange. If I were smart, I would have browsed the previously submitted Session based reports before I wrote my own, but that wouldn’t nearly have been as fun!




43 Comments
Hi,
Question: please, the Sessions report that comes out of the box in SQL Developer in its base query
I noticed this line “and nvl(vs.osuser,’x’) ‘SYSTEM'” and I was wondering what could be the purpose
of it? interestingly, in one of the applications I provide support the database connections coincidently
the application server os user is SYSTEM and every time the report is run the connections are excluded?
Thank you
Hi Jeff,
Is there any way to make user reports visible in the toolbar so they can be run with a single click rather than having to drill down?
Hello Jeff,
Can you tell the query that is run in the background(sql query) when the command :Tools – Monitor Session is launced.
Thanks you,
Regards,
Sameer
copy the report down to user defined reports and edit the properties to get to the SQLs, or View > Log > Statements…run the report. You’ll see your query.
Hello Jeff,
Thanks for the reply.
I have tried the solution you have proposed, but it does not fit in my context.
I want to know, which query is launched by sql developper in the background when I select the option :Tools – Monitor Session in sqldevelopper?
My aim is run the sql query and get the results without having to through the option tools > monitor session.
Note: My sqldevelopper is installed in french language
Thank you in advance for your help.
Regards,
Sameer
if you tried what i suggested, you’d have the query already. what did you get when you tried? Tools > Monitor Sessions is the exact same page as the report that i talk about customize in this blog post.
Or…run Tools > Monitor Sessions with View > Log > Statements panel open and you’ll see the queries that page runs.
Hello jeff,
I did not copy the report sessions down to user defined reports before. It is shared sqldevelopper installed on one of our serveurs, so no modification is allowed 🙂
Once I have done this step, I have got the query in the property box.
The option View > Log > Statements panel is not available in the french version of sqldevelopper Version 4.1.1.19 (Affichage).
The query below for anyone who might be interested:
select inst_id,program,module,event,SQL_ID,machine,
lpad(
to_char(
trunc(24*(sysdate-s.logon_time))
) ||
to_char(trunc(sysdate) + (sysdate-s.logon_time)
, ‘:MI:SS’
)
, 10, ‘ ‘) AS UP_time from gv$session s where type!=’BACKGROUND’
and status=’ACTIVE’ and sql_id is not null
Thank you for your help.
Regards,
Sameer
>>The option View > Log > Statements panel is not available in the french version of sqldevelopper Version 4.1.1.19 (Affichage).
more likely you’re running a THICK connection, the Statements panel is only avail for Thin JDBC connections
BTW, you can install sqldev 4.1.3 on your personal machine in less than 5 minutes, then you can do whatever you want
Hi Jeff,
I get same error “ora_00942_table_or_view_does_not_exist” ., as sessions quering gv$session . I can run manually by taking the query and modified to v$session . But how can add my code/modify existing to run automatically through sessions and display me the sessions .
Thanks in advance
you can change the query to v$session or you can ask your DBA to grant you select privs on the GV$ views
Ok. Let me make one more telling comment. All of this worked fine if i ran the reports as admuser. We are trying to run as a different user and it’s failing. How can I tell what rights the admuser has access to to run the reports corrects where this account we created does not. My DBA says it has the access to v$session and v$sql .
Thanks for the help!
ask your DBA you need access to GV$…fixing every report will soon get tiring for you
I came to your blog b/c when running the report I was getting error 942 table or view does not exist. however when I run a select * from V$session and select * from V$sql I get results. Can you help explain that? I’m not a developer and my sql is ok. I don’t know what it is trying to open. When my co-worked does this on an earlier version of sql developer using the same credentials it works fine for her. She is on 3.2.20.09. I am on 4.0.2.15. Any help you can give I would greatly appreciate.
in version 4, we go against the gv$ views – this post tells you exactly how to see AND change this query
I made the changes and now am getting below. Any suggestions When I open the session report I am now getting sessions but when I click on the additional tabs for explain plan, waits, servers etc I get below… Thanks in advance…
An error was encountered performing the requested operation:
ORA-00904: “SP”.”INST_ID”: invalid identifier
00904. 00000 – “%s: invalid identifier”
*Cause:
*Action:
Vendor code 904
each of those tabs have their own queries, which may or may not ALSO be touching the GV$ views
Nope, the code did not substitute SERIAL#. I tried again, this time deleted the report definition from the User Defined Reports tree. Added another # to make it #SERIAL## and imported the Report back in and this time the code generated was fine. I guess … well I don’t know what to guess….but it’s a cool trick. Thanks.
This is a nice article, but it would really help to have the code for the report to be able to see the finished product.
Thanks
It’s really about showing how you can changed it, not how you SHOULD change it. I shared the code behind the XPLAN and the sql statement with linebreaks. What else do you need help with?
Regarding SQL formatting in the “Active SQL” tab: in sql developer 4.0.2.15, you can try setting the following preference for that:
tools / preferences / database / sql formatter
=> check “autoformat visible sql and pl/sql”
A nice preference, but it’s not applied to that panel.
and uh, forgot to ask. Writing my own reports is nice, but I usually need access to sessions ASAP. Is there a way to put my report somewhere in the menu, or as a button on the toolbar?
Hm, so basically, longopsq is broken in default Session report in 3.2 – even though the child report is present, the SQL_ID column in master query isn’t. I guess it’s about time to play around with my very own session report! Using gauge in longopsq made it look pretty =)
Regarding the current SQL text – after searching around asktom, I stumbled upon gv$sqltext_with_newlines , which retains all whitespace along with newlines; so if query is rewritten like this:
select replace(sql_text,chr(0),chr(10))
from gv$session s,gv$sqltext_with_newlines q
where s.sql_address = q.address
and s.sql_hash_value = q.hash_value
and s.sid = :SID
order by piece
then you get all your whitespace and newlines as they were inputted. However, when I tried to view other user’s query that was executed from a package, it actually disregarded any formatting. I guess, those queries are condensed at compile time…
Which report exactly are you saying the LONGOPS child report is broken?
The “Sessions” one, the same one which is called from the Tools->Monitor Sessions. Last child repost, “long opsq”, doesn’t work for me (always showing a blank table). If I copy “Sessions” report to the user defined reports and view its contents, there’s no “SQL_ID” column in the main query.
I didn’t customize the Waits child report, so it’s the same as yours.
For tab “Waits”, what is your code? would you please post it here
I just shared the code from the xplan and sqltext formatting. I can easily share the SQL from the other pages I changed though. Will try to remember that for tomorrow!
Were you meaning to provider a link to your code? Didn’t see one…
I was thinking that it would be very nice to be able to run a report as an “unshared SQL” (in a separate session) while running other stuff like a long update and you just want to check v$session_longops to see how much it did so far.
Is this feature available in Oracle SQL Developer?
Many thanks!
There’s no way to launch an unshared connection for a Report, but what you CAN do is this:
Does this help?
The unshared SQL Worksheets are ‘unshared.’ Their connection name is such that none of the other features in the tool will be able to take advantage of it, so you’re guaranteed a session to be used ONLY by the worksheet.
The idea with creating a new connection for Reports is very good!
Before discovering your blog post with “unshared SQL workheet”, I was using two Oracle SQL Developer applications in parallel, I didn’t thought of creating a new connection 🙂
You are doing a very good job with promoting the features of Oracle SQL Developer on this blog!
Many thanks for your quick response!
If WordPress would let me, I’d ‘Like’ your comment Alin 🙂
Please keep sending in your questions and feedback – user interaction is where I get most of my topics and post ideas from!
Nice reporting feature, Data dictionary reports> ASH & AWR ….adding ADDM report here would be good idea?
A good bit of work, but not a bad idea 🙂 Why not submit it to our Exchange?
I ran the active session report this morning during the stress testing of our apps. Ironically, the session report used 4G of temp tablespace, and thus make all other apps failed. Why SQL Developer 4.0 needs so many temp table for just a simple session report?
We’re just running queries. Which query was it? The session one, or SQLText, Explain Plan, Bind Variables, or Long Ops bits?
The session report generate Cartesian join like this:
WITH locks AS
(
SELECT session_id ,
lock_type ,
mode_held ,
mode_requested,
lock_id1 ,
lock_id2 ,
blocking_others
FROM sys.dba_lock
)
,
waiters AS
(
SELECT w.session_id waiting_session ,
h.session_id holding_session ,
w.lock_type lock_type ,
h.mode_held mode_held ,
w.mode_requested mode_requested,
w.lock_id1 ,
w.lock_id2
FROM locks w,
locks h
WHERE h.blocking_others = ‘Blocking’
AND h.mode_held != ‘None’
AND h.mode_held != ‘Null’
AND w.mode_requested != ‘None’
AND w.lock_type = h.lock_type
AND w.lock_id1 = h.lock_id1
AND w.lock_id2 = h.lock_id2
AND
(
w.session_id = :SID
OR h.session_id = :SID
)
)
,
blockers AS
(
SELECT holding_session waiting_session,
to_number(NULL) holding_session,
‘None’ lock_type ,
NULL mode_held ,
NULL mode_requested ,
NULL lock_id1 ,
NULL lock_id2
FROM waiters minus
SELECT waiting_session waiting_session,
to_number(NULL) holding_session,
‘None’ lock_type ,
NULL mode_held ,
NULL mode_requested ,
NULL lock_id1 ,
NULL lock_id2
FROM waiters
)
,
waiters_blockers AS
(
SELECT waiting_session,
holding_session,
lock_type ,
mode_held ,
mode_requested ,
lock_id1 ,
lock_id2
FROM waiters
UNION ALL
SELECT waiting_session,
holding_session,
lock_type ,
mode_held ,
mode_requested ,
lock_id1 ,
lock_id2
FROM blockers
)
,
lock_objects AS
(
SELECT session_id ,
cnt lock_obj_count,
CASE
WHEN cnt = 1
THEN object_name
ELSE NULL
END object_name,
object_id ,
owner ,
object_type
FROM
(
SELECT session_id ,
COUNT(DISTINCT object_name) cnt,
MAX(object_name) object_name ,
MAX(lo.object_id) object_id ,
MAX(ao.owner) owner ,
MAX(object_type) object_type
FROM gv$locked_object lo,
all_objects ao ,
waiters_blockers wb
WHERE lo.object_id = ao.object_id
AND
(
wb.waiting_session = lo.session_id
OR wb.holding_session = lo.session_id
)
GROUP BY session_id
)
)
,
wait_block_ses AS
(
SELECT waiting_session ,
holding_session ,
lock_type ,
mode_held ,
mode_requested ,
s.username ,
s.osuser ,
s.CLIENT_INFO ,
s.CLIENT_IDENTIFIER,
o.object_name ,
o.owner ,
o.object_id ,
module ,
o.object_type ,
o.lock_obj_count ,
DECODE(s.command, 0,NULL, 1,’CRE TAB’, 2,’INSERT’, 3,’SELECT’, 4,’CRE CLUSTER’, 5,’ALT CLUSTER’, 6,’UPDATE’, 7,’DELETE’, 8,’DRP CLUSTER’, 9,’CRE INDEX’, 10,’DROP INDEX’, 11,’ALT INDEX’, 12,’DROP TABLE’, 13,’CRE SEQ’, 14,’ALT SEQ’, 15,’ALT TABLE’, 16,’DROP SEQ’, 17,’GRANT’, 18,’REVOKE’, 19,’CRE SYN’, 20,’DROP SYN’, 21,’CRE VIEW’, 22,’DROP VIEW’, 23,’VAL INDEX’, 24,’CRE PROC’, 25,’ALT PROC’, 26,’LOCK TABLE’, 28,’RENAME’, 29,’COMMENT’, 30,’AUDIT’, 31,’NOAUDIT’, 32,’CRE DBLINK’, 33,’DROP DBLINK’, 34,’CRE DB’, 35,’ALTER DB’, 36,’CRE RBS’, 37,’ALT RBS’, 38,’DROP RBS’, 39,’CRE TBLSPC’, 40,’ALT TBLSPC’, 41,’DROP TBLSPC’, 42,’ALT SESSION’, 43,’ALT USER’, 44,’COMMIT’, 45,’ROLLBACK’, 46,’SAVEPOINT’, 47,’PL/SQL EXEC’, 48,’SET XACTN’, 49,’SWITCH LOG’, 50,’EXPLAIN’, 51,’CRE USER’, 52,’CRE ROLE’, 53,’DROP USER’, 54,’DROP ROLE’, 55,’SET ROLE’, 56,’CRE SCHEMA’, 57,’CRE CTLFILE’, 58,’ALTER TRACING’, 59,’CRE TRIGGER’, 60,’ALT TRIGGER’, 61,’DRP TRIGGER’, 62,’ANALYZE TAB’, 63,
‘ANALYZE IX’, 64,’ANALYZE CLUS’, 65,’CRE PROFILE’, 66,’DRP PROFILE’, 67,’ALT PROFILE’, 68,’DRP PROC’, 69,’DRP PROC’, 70,’ALT RESOURCE’, 71,’CRE SNPLOG’, 72,’ALT SNPLOG’, 73,’DROP SNPLOG’, 74,’CREATE SNAP’, 75,’ALT SNAP’, 76,’DROP SNAP’, 79,’ALTER ROLE’, 79,’ALTER ROLE’, 85,’TRUNC TAB’, 86,’TRUNC CLUST’, 88,’ALT VIEW’, 91,’CRE FUNC’, 92,’ALT FUNC’, 93,’DROP FUNC’, 94,’CRE PKG’, 95,’ALT PKG’, 96,’DROP PKG’, 97,’CRE PKG BODY’, 98,’ALT PKG BODY’, 99,’DRP PKG BODY’, TO_CHAR(s.command)) command
FROM waiters_blockers wb,
gv$session s ,
lock_objects o
WHERE s.sid = wb.waiting_session
AND o.session_id(+) = wb.waiting_session
)
SELECT
CASE
WHEN holding_session IS NULL
THEN ‘Lock’
ELSE ‘Lock Waiting’
END status ,
waiting_session,
username ,
object_name ,
object_id ,
owner ,
object_type
FROM wait_block_ses START
WITH holding_session IS NULL CONNECT BY prior waiting_session = holding_session
I’m seeing a cost of less than 500, and no cartesians in the Explain Plan. The SQL Tuning Advisor is also saying everything ‘OK.’ Of course that could be different on your side. Can you put me in contact with your DBA?
Monitoring session is a common task. If the query is well-designed, and its functionality should be independent of the configuration of backend database. That means the session report should work anyway, as good as you did. But in reality, it failed at some database, at least, in our database.
I would agree, BUT, I don’t know what your data dictionary stats are like. If they’re stale, that could make all the difference.
Never run the session reports in SQL Developer, it generates Cartesian join that can easily run out of tablespace (e.g., 5-10G), and make all other queries failed.
I am disappointed why SQL Developer is so buggy, and have caused big problems here when we did load testing.
A cartesian join on what? I want to help you, but can you be more specific? We have about 4 million people using this tool, and this is the first time I’ve ever heard anything like this.