Update: Jan 17, 2020
Unless you’re on a really old version of SQL Developer, you don’t need to do this anymore. We automatically grab this info for you and show it in the Log panel.
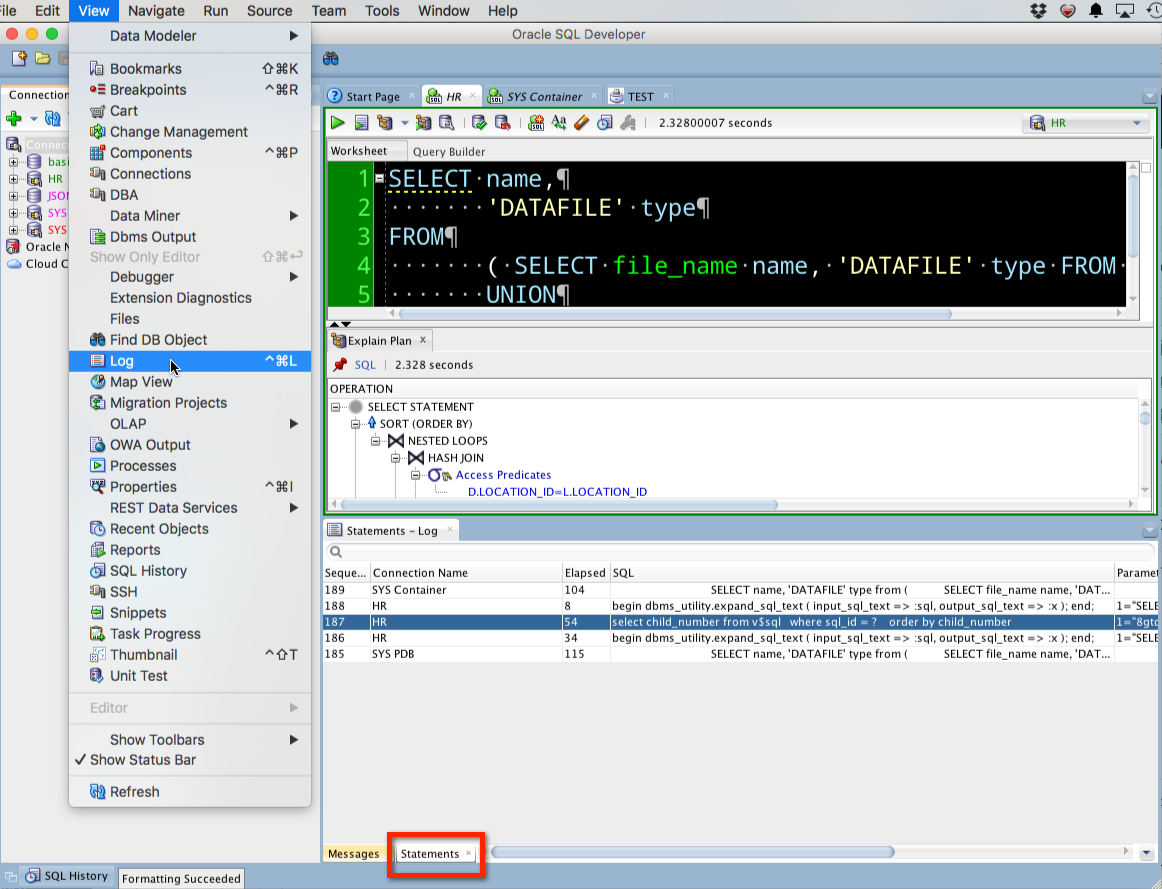
Still running something like version 1,2,3? Then continue on. Otherwise, you can learn more about the Statements panel here.
Curious how we’re getting the data you see in SQL Developer when you click on something? While many of the dialogs provide a ‘SQL’ panel that shows you the SQL ABOUT to be generated, I’d rather see the SQL AS it’s executed.
True, you could set a TRACE or fire up a Monitor Sessions report, but both of those solutions leave me hungry for more.
Did you know that SQL Developer has a ‘debug’ mode? It slows the tool down a bit and spits out a lot of information you don’t care about, but it ALSO shows you ALL the SQL that is sent to the database, as you click around the tool!
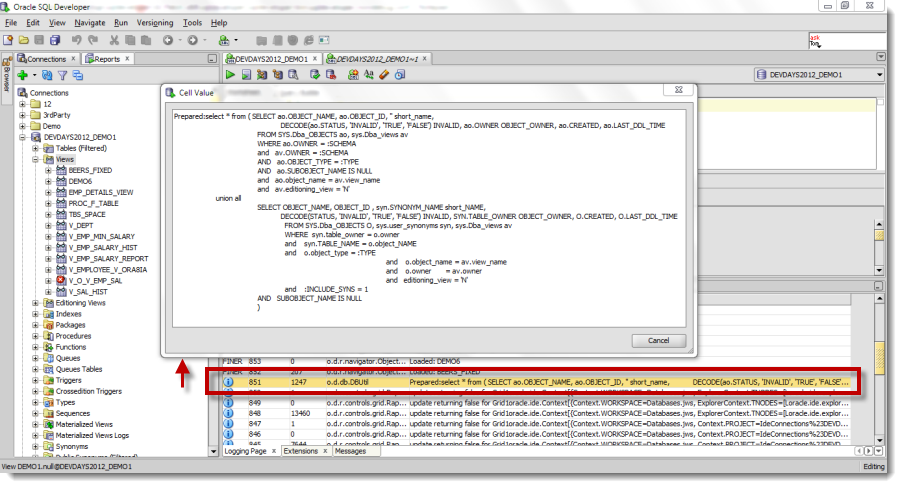
Enable DEBUG Mode
When you see the splash screen as SQL Developer fires up, frantically hit Up, Up, Down, Down, Left, Right, Left, Right, B, A, SELECT, Start.
Wait, wrong game.
No, all you need to do is go to your SQL Developer directory and navigate down to the ‘bin’ directory. In that directory, find the ‘sqldeveloper.conf’ file.
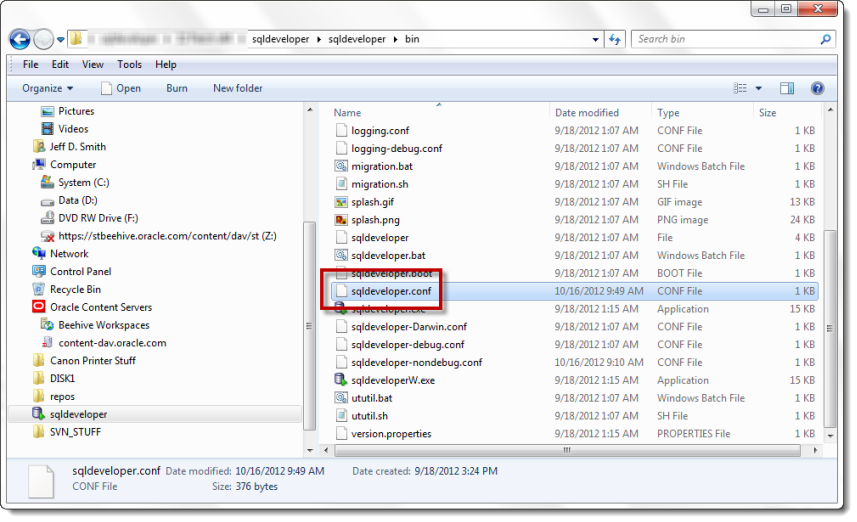
Open it with a text editor.
Find this line
IncludeConfFile sqldeveloper-nondebug.conf
And replace it with this line
IncludeConfFile sqldeveloper-debug.conf
Save the file.
Start up SQL Developer.
Observe the Logging Page – Log Panel for the SQL
There’s going to be more than just SQL here. You’ll actually see a LOT of other information. If you’re having general problems with the tool and you want to see the nitty-gritty of what’s going on, then this is a good place to satisfy your curiosity and might help us diagnose your issue if you post to the forums or open a ticket with My Oracle Support.
You’ll find ‘INFO’ entries that look a little something like this –
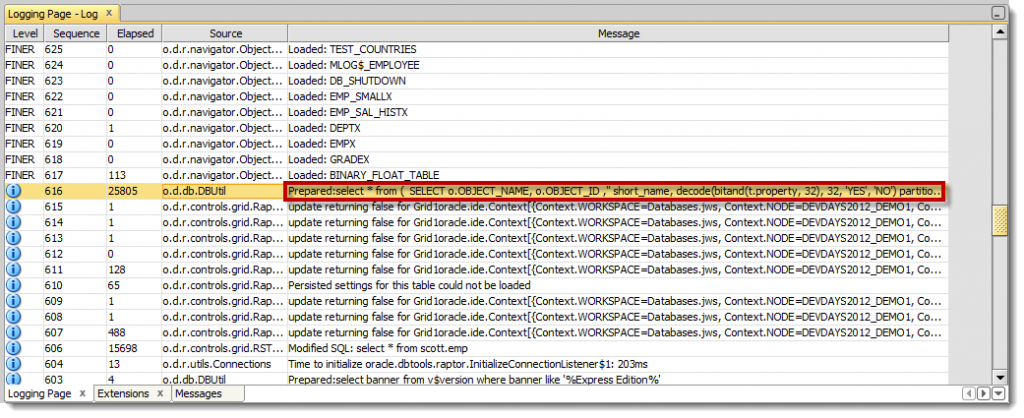
You can double-click on the sql text and get a pop-up window that’s much easier to read.
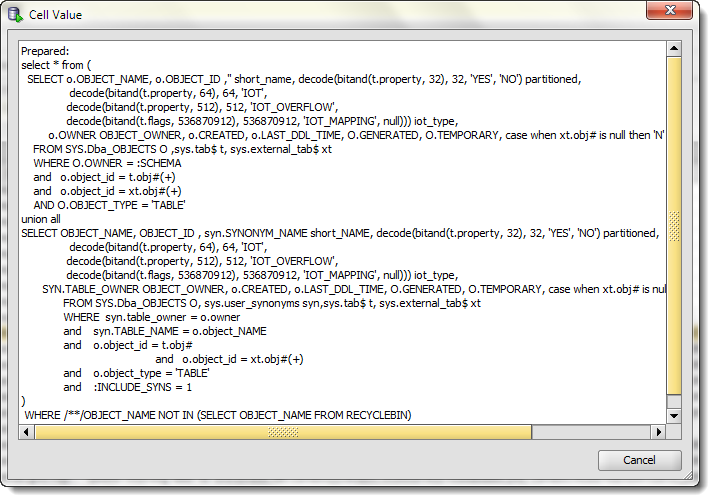
I don’t recommend running in DEBUG mode all the time. Capturing this information and displaying it is more expensive than not doing so. And it provides a lot of information you don’t normally need to see. But when you DO want to know what’s going on and why, this is an excellent way of getting that information.
When you’re ready to go back to ‘normal’ mode, just close SQL Developer, go back to your .conf file, and add the ‘nondebug’ bit back.


12 Comments
Can this log sql statements from other connections or modules like apex or sqlcl?
Nope. You’ll need to trace the session in the database.
Hi Jeff, Thank you very much for your confirmation.
Thank you.
This setting debugs all actions done in my open insatnace of the Oracle SQL Developer.
When working within the programmed apex-webapplication the sql-commands triggered there are not shown.
Shouldn’t this debug mode catching all (sql) querys done on the database (no matter where they come from)?
No.
What you’re describing is a trace – if you want to capture all the SQL being executed on the database.
I follow the steps, but in Logging tab I can see only SQL statements from SQL worksheets. When I am debugging an existing procedure, I can see a new line with Source: o.d.r.runner.DBSourceFinder but no SQL in message cell. Is there a way to see which SQL statements are called when debugging, with all parameters populated? thanks
It just got a lot easier in version 4.1. Go try this.
Not the expected result. I modified the parm to ‘debug’ and debug stopped working! I got plenty of messages, just a non functioning debug. Switched it back and debug worked again. Go figure
‘debug worked again’ – do you mean the Pl/SQL debugger? Those topics aren’t related…
Hi
Thanks for this note.
Do you have a workaround when there is a firewall between client and Server ?
You have ORA-30638
:o/
Any ideas ?
Thanks
Gram
You mean suggestions like, get behind the firewall, use a VPN, or have your network admin open a port for JDBC or SQLNet?
THANK YOU