“Explain Plans are useless.”
Yikes. Really? Don’t we spend all day looking at execution plans?
To clarify, I would say that explain plans could be useless.
If you do an Explain, you’re actually looking at a theoretical plan, not the ‘actual’ plan.
From the docs:
With the query optimizer, execution plans can and do change as the underlying optimizer inputs change. EXPLAIN PLAN output shows how Oracle runs the SQL statement when the statement was explained. This can differ from the plan during actual execution for a SQL statement, because of differences in the execution environment and explain plan environment.
So for version 4.0 of SQL Developer, when you’re in the worksheet and you want to see a plan, you now have the option to look at the plans in V$SQL_PLAN for your query.
From the docs:
After the statement has executed, you can display the plan by querying the V$SQL_PLAN view. V$SQL_PLAN contains the execution plan for every statement stored in the cursor cache. Its definition is similar to the PLAN_TABLE. See “PLAN_TABLE Columns”.
The advantage of V$SQL_PLAN over EXPLAIN PLAN is that you do not need to know the compilation environment that was used to execute a particular statement. For EXPLAIN PLAN, you would need to set up an identical environment to get the same plan when executing the statement.
So what does this look like in SQL Developer now?
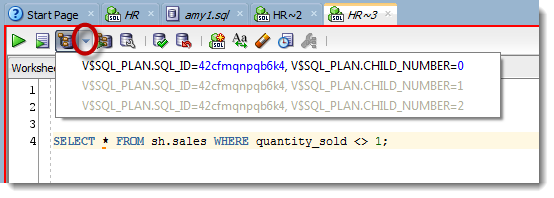
If you click on the drop-down bit of the Explain Plan button, what you’ll see are a list of the cached plans for that statement – that is, plans that were ACTUALLY used to execute the statement.
We’re parsing the text in the worksheet and finding the SQL IDs in the V$SQL_PLAN view that match.
As my almost-two year old son likes to now proclaim after doing something ‘awesome,’ TA-DA!

TA-DA indeed.
But wait, there’s more!
New Autotrace Option to Fetch All Rows
Previously when running an autotrace in SQL Developer, we would only fetch the first batch of records. This meant that you were missing a good bit of physical I/O, meaning that only doing a single fetch could have a big impact on statistics in certain cases. For example if the data being accessed was compressed or if the number of rows being returned was large, etc.
To alleviate that, we’ve added a new preference for Auto Trace:
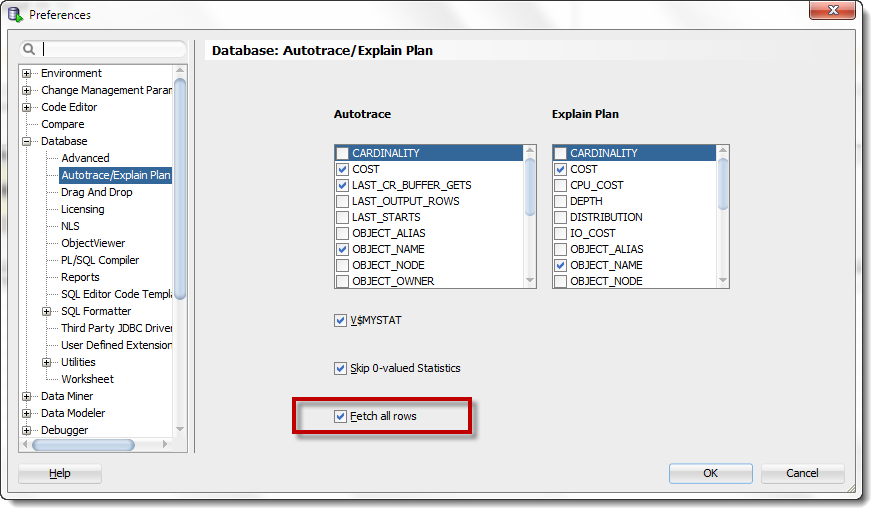
So when reading the results, you’re not faced with several dozen irrelevant numbers, you can just skip to the good stuff!
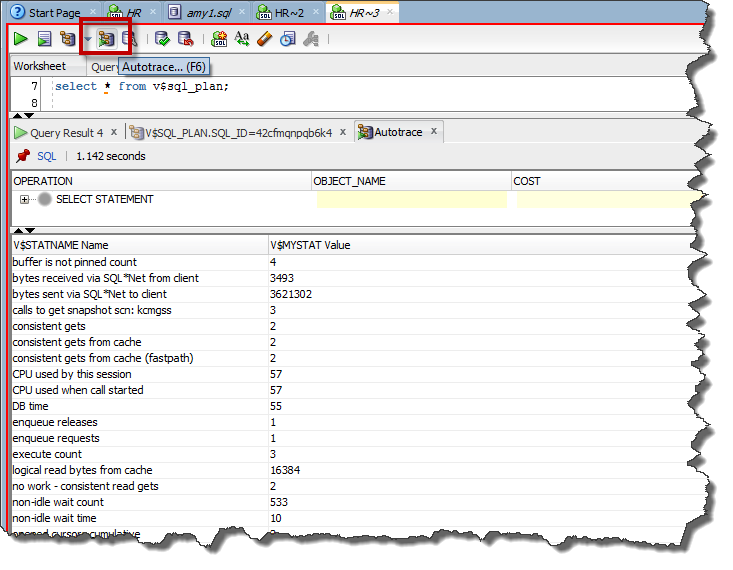
Actually we added two preferences. The other check box on that screen says ‘Skip 0-Valued Statistics.’
No more dozens of entries with 0 stats…
Oh Sir, Just One More Thing…
Plans can be a bear to read. Several of you have requested that we enable the ‘zebra’ pattern property for the grids used to display plans. That’s been done for version 4.0, and if you look at the screen captures above, you can observe this your yourself.


41 Comments
Hello Jeff,
Thanking you so much for share your knowledge to others.
Could you please provide Performance tuning documentation.
Regards
RAJ
here you go
Hi Jeff, for some reason the actual execution plan under Explain Plan button is always grayed out for me. I am on 4.1.
I do have access to V$SQL_PLAN and can get actual plan manually.
Do you know why it is grayed out?
Bug
Close your worksheet, re-open
Write query
Run query
Click on the drop-down, should be there
We have it fixed for our next patch.
Any way to show DOP info in SQL Developer’s explain plan or autotrace panels? dbms_xplan.display() offers a note at the bottom of its listing:
Note
——
– automatic DOP: Computed Degree of Parallelism is 30 because of degree limit
It would be useful to see the computed DOP somewhere in SQL Developer’s explain plan or autotrace features.
It would be nice to see DOP info in the SQL Developer “explain plan” panel. Using dbms_xplan.display() adds a little note at the end:
Note
——
– automatic DOP: Computed Degree of Parallelism is 16 because of degree limit
Any way to include this in SQL Developer’s explain plan or autotrace features?
never mind, figured it out. You have to run both statements (the sql and the xplan) at the same time.
F5 not working for me; I still don’t get plan output. Am I missing a step or magic incantation? Otherwise I will just go back to SQLDeveloper 3.
>>Note the drop-down control added to the Explain Plan button in the worksheet toolbar.
This is a total disaster.
Please make an option to disable this “feature” or just disable it.
This “feature” blocks using dbms_xplan.
I typically use gather_plan_statistics hint and select * from table(dbms_xplan.display_cursor(”,”,’ALLSTATS LAST’)) to get text version of autotrace.
Being able to get text version of autotrace is absolute must so it can be attached for peer review (e.g. attached to ticket management system).
As SQL Developer tries to figure out sql_id it runs additional queries, thus v$session.prev_sql_id becomes useless.
The feature itself is of NO use:
1) It does NOT tell you which child number was actually used. WTF is the list of child numbers? What should performance engineer do with the list? Open each and every plan? What if all are the same? What if they differ?
If you see any good use of the feature, please blog about it. Your example “a screenshot with query just single child cursor” is just a toy example that has nothing to do with real business.
Please, do that. I’ll be happy to learn something new.
2) It does NOT tell you the actual row counts, cpu time, logical reads, physical reads that happened along execution plan.
Execution plan means nothing. Having row counts, cpu time, logical/physical reads is a must to compare execution plans.
3) The feature breaks all the tools that use “prev_sql_id” (e.g. display_cursor procedure, reports that show “current/prev activity of session”, etc.)
Lots of things here.
‘Disaster’ – interesting choice of words.
If you want a text version of autotrace, why not just ask for it?
[text]
set autotrace on
select * from beer where city like ‘%North Carolina%’;
–execute as script
Autotrace Enabled
Shows the execution plan as well as statistics of the statement.
no rows selected
Plan hash value: 84381963
——————————————————————————————-
| Id | Operation | Name | Rows | Bytes | Cost (%CPU)| Time | Pstart| Pstop |
——————————————————————————————-
| 0 | SELECT STATEMENT | | 590 | 34810 | 35 (0)| 00:00:01 | | |
| 1 | PARTITION HASH ALL| | 590 | 34810 | 35 (0)| 00:00:01 | 1 | 3 |
|* 2 | TABLE ACCESS FULL| BEER | 590 | 34810 | 35 (0)| 00:00:01 | 1 | 3 |
——————————————————————————————-
Predicate Information (identified by operation id):
—————————————————
2 – filter("CITY" LIKE ‘%North Carolina%’)
Statistics
———————————————————–
2 CPU used by this session
2 CPU used when call started
2 DB time
14 Requests to/from client
14 SQL*Net roundtrips to/from client
387 bytes received via SQL*Net from client
24171 bytes sent via SQL*Net to client
2 calls to get snapshot scn: kcmgss
6 calls to kcmgcs
127 consistent gets
127 consistent gets from cache
127 consistent gets from cache (fastpath)
2 cursor authentications
1 enqueue releases
1 enqueue requests
2 execute count
1040384 logical read bytes from cache
121 no work – consistent read gets
14 non-idle wait count
2 opened cursors cumulative
1 opened cursors current
1 parse count (hard)
2 parse count (total)
1 parse time cpu
1 recursive calls
1 recursive cpu usage
127 session logical reads
-262144 session pga memory
1 sorts (memory)
638 sorts (rows)
121 table scan blocks gotten
11955 table scan rows gotten
3 table scans (short tables)
15 user calls
3 workarea executions – optimal
[/text]
Also, instead of asking for the last SQL in XPLAN, now you know the SQLID, so just feed it that for your xplan function call.
OR
You can still do everything you’re doing today, but when you run your script to get your performance diagnostics, select the query and your code, and execute all of it via Ctrl+Enter. The query we run to get the SQLID won’t get in your way.
>>If you want a text version of autotrace, why not just ask for it?
I mean I need a text version of dbms_xplan.display_cursor.
“sqlplus autotrace” is useless for real tuning cases.
It does not reveal _which_ table consumed logical/physical reads.
>>Also, instead of asking for the last SQL in XPLAN, now you know the SQLID, so just feed it that for your xplan function call.
That really blocks fast turnaround since you’ll have to constantly get new sql_ids, copy paste/etc.
When tuning a query an important thing is to keep eye on the correctness of the results.
So regular execution (F9) is useful to validate results visually (results are much more readable in table view that when in text format).
Can be “prefetch values for explan plan drop down” and optional feature?
Say an option to either SQLDeveloper prefetches “child numbers” right after execution or fetch values only if user clicks that magic drop-down.
I’ve already noted this request as a talking point for 4.1 features list.
Also, if you run via F5, this should work no problem.
[sql]
select * from beer where city like ‘%North Carolina%’;
SELECT * FROM table(DBMS_XPLAN.DISPLAY_CURSOR);
PLAN_TABLE_OUTPUT
————————————————————————————————————————————————————————————————————————————————————————————————————
SQL_ID fj8nt2ku80915, child number 1
————————————-
select * from beer where city like ‘%North Carolina%’
Plan hash value: 84381963
——————————————————————————————-
| Id | Operation | Name | Rows | Bytes | Cost (%CPU)| Time | Pstart| Pstop |
——————————————————————————————-
| 0 | SELECT STATEMENT | | | | 35 (100)| | | |
| 1 | PARTITION HASH ALL| | 590 | 34810 | 35 (0)| 00:00:01 | 1 | 3 |
|* 2 | TABLE ACCESS FULL| BEER | 590 | 34810 | 35 (0)| 00:00:01 | 1 | 3 |
——————————————————————————————-
Predicate Information (identified by operation id):
—————————————————
2 – filter("CITY" LIKE ‘%North Carolina%’)
19 rows selected
[/sql]
F5 does the trick. As a WA that’s acceptable. Thank you.
F5 does not support “trimout on”.
I mean when copy-pasting F5’s results you get lots of spaces after the real output (see horizontal scrollbar in your text).
That is why I abandoned using F5 for this scenario long ago.
Is there a way to trim spaces?
Excellent, I always used DBMS_XPLAN before to get around the explain plan issue, nice to see an alternative right inside SQL Developer.
Hello Jeff,
Is it possible somehow to change format of LAST_ELAPSED_TIME column in SQL Developer Autotrace option?
Especially in big statements it is difficult to read and compare that numbers if you are working on query…
Many thanks
LAST_ELAPSED_TIME isn’t in v$statname, where are you seeing this?
V$SQL_PLAN_STATISTICS
http://docs.oracle.com/cd/E11882_01/server.112/e25513/dynviews_3056.htm
I mean SQL Developer should have couple of more checkboxes in Tools -> Preferences -> Database -> Autotrace/Explain plan -> Autotrace (on the left)
LAST_CR_BUFFER_GETS, LAST_OUTPUT_ROWS, LAST_STARTS are already there.
The following columns should be added:
LAST_DISK_READS, LAST_DISK_WRITES, LAST_ELAPSED_TIME
Jeff,
please, we will be able to choose more columns from V$SQL_PLAN_STATISTICS for autotrace in future releases of SQLDeveloper?
I put these request in SqlDeveloper Exchange months ago.
Thanks
I don’t see your exchange item, can you send me the link? We grab all of the stats already – what columns exactly are you looking for.
Hi Jeff, in really it was many months ago :-),
https://apex.oracle.com/pls/apex/f?p=43135:7:17376883396116::NO:RP,7:P7_ID:32741
however I cant see the column LAST_ELAPSED_TIME (for example) on the autotrace
options. There was this option in the version 3.
I am using SQLDev 4.02
Thanks
I see it in my copy of v4.0.2 and connected to a 12.1.0.1 database?
Humm, sad but I haven’t.
I will investigate more …
I am connected to a 11.2
Anyway, thanks for your attention
Hi Jeff,
I upgrade my SQLDev to Oracle IDE 4.0.3.16.84
but still cant to see all options (columns from V$SQL_PLAN_STATISTICS).
Do you have some idea why?
Like which ones?
Well, are the autotrace options fixed in code? Or maybe based in the connected databases a query is executed, I really don’t know, possibly a privilege problem.
Thanks for your time
We pull the stats available from the data dictionary. For instance, if you’re on 12.1.0.2 you’ll start seeing the new in-memory stats…
>We pull the stats available from the data dictionary. For instance, if you’re on 12.1.0.2 you’ll start seeing the new in-memory stats…
Jeff, you’ve confused two items.
We are talking on “per-plan-line” information (like LAST_ELAPSED_TIME), while you mention “overall summary” statistics (like “in-memory stats”)
Can you open V$SQL_PLAN_STATISTICS for a moment and/or ask developers if they could use more columns from that view?
Yup, sorry for crossing the streams. I could, but if I asked them to do that every time a user asked for something, I’d very quickly not be the product manager anymore.
I’ll add it as a ‘something to think about’ item for our next version when we do product planning. If you want to help push that along, add it as a request in the Exchange and submit a formal Service Request to My Oracle Support.
I’m not picking on you per se, but everyone reading this needs to understand you can’t shortcut our dev processes by just reaching out to me or Kris directly…usually.
4) The true zebra is just black and white. Your zebra is 5 colours (4 different shades of gray plus white). Is there a chance to see more simplistic 2-colour zebra in 4.0?
Just white and some shade of gray coming through the whole row (including the tree). I see no reason in using different tint for odd columns.
So it’s faux-zebra 🙂
I see your point, but that’s how the grids are setup in general. We could add a secondary preference, but seems like overkill at this point in time.
Very cool stuff!
Really amazing. It is truly wonderful to have “full fetch”, “skip 0-value stats” in 4.0.
Thank you for your work, this really helps.
Some comments:
1) I would love to see full-fledged “tab colouring”. There are some rabbit ears on your screenshots (that red border!), but current implementation is broken. Tab titles must be coloured, so you can identify connections _before_ you click to switch the tab
2) In case you come to tab headers update, please, I beg you, implement “vertical tab titles” mode. The text itself should be horizontal, but the labels should be on a left or right side of the window.
It might sense creating a special window to switch tabs, so you can place the list of “tabs” side-by-side with connections/reports windows.
3) I find new menu background too dark, thus I have to switch to Windows look and feel as menu labels are hard to read in Oracle LAF.
We looked at tab colouring, but doing that required something more along the lines of hacking the framework to make it happen, so we went with the editor outline. You can ID a doc before clicking on it by simply doing a mouse-over, you’ll get the connection name as context hint.
For vertical tab titles, can you show me an example of this? Not sure I quite get what you’re asking for?
So you’re OK with the Oracle LAF? We’re investigating opening up the LAF going forward, but probably won’t happen for this release. We’re with you – SQL Developer CAN and WILL look better 🙂
Just out of curiosity, what do you mean by “opening up the LAF”? Currently I’m using the Oracle LAF and it’s fine for me. Also, I’m thoroughly enjoying having my own custom editor backgroud color 😀
The Look and Feel themes for the Oracle LAF have been deprecated. So you can’t set it to ‘Sky Yellow’ or ‘Desert Red’ anymore.
Ah, gotcha. I have to say, I do miss the Sky Yellow theme.
Here’s screenshot for “tabs on left”: http://i.imgur.com/2OVIvuh.png
During my typical workflow I open 10-20 windows, and they do not fit horizontally on 20″ screen.,
>>So you’re OK with the Oracle LAF?
I’m not OK with 4.0’s Oracle LAF. In 4.0 menu bar became too dark.
use the drop arrow on the far right of the document list of tabs – it will give you the vertical list of editors/docs that you want
I do know the arrow, however it is unusable.
Drop arrow is inconvenient as:
1) the list is not visible before you click
2) it forces you to perform additional action (click arrow), and the arrow is very small.
3) there is no easy way to reorder tabs
I think unusable is a little harsh. It’s there now, vs what you want, which probably won’t be there for a long time, if ever.