Oracle 11gR1 Enterprise Edition with the Diagnostic and Tuning packs has a very compelling new feature, Real-Time SQL Monitoring. Oracle thinks enough of the feature that it was highlighted prominently in whitepaper by ACE Directory Arup Nanda titled “Oracle Database 11g: The Top Features for DBAs and Developers” (read it here)
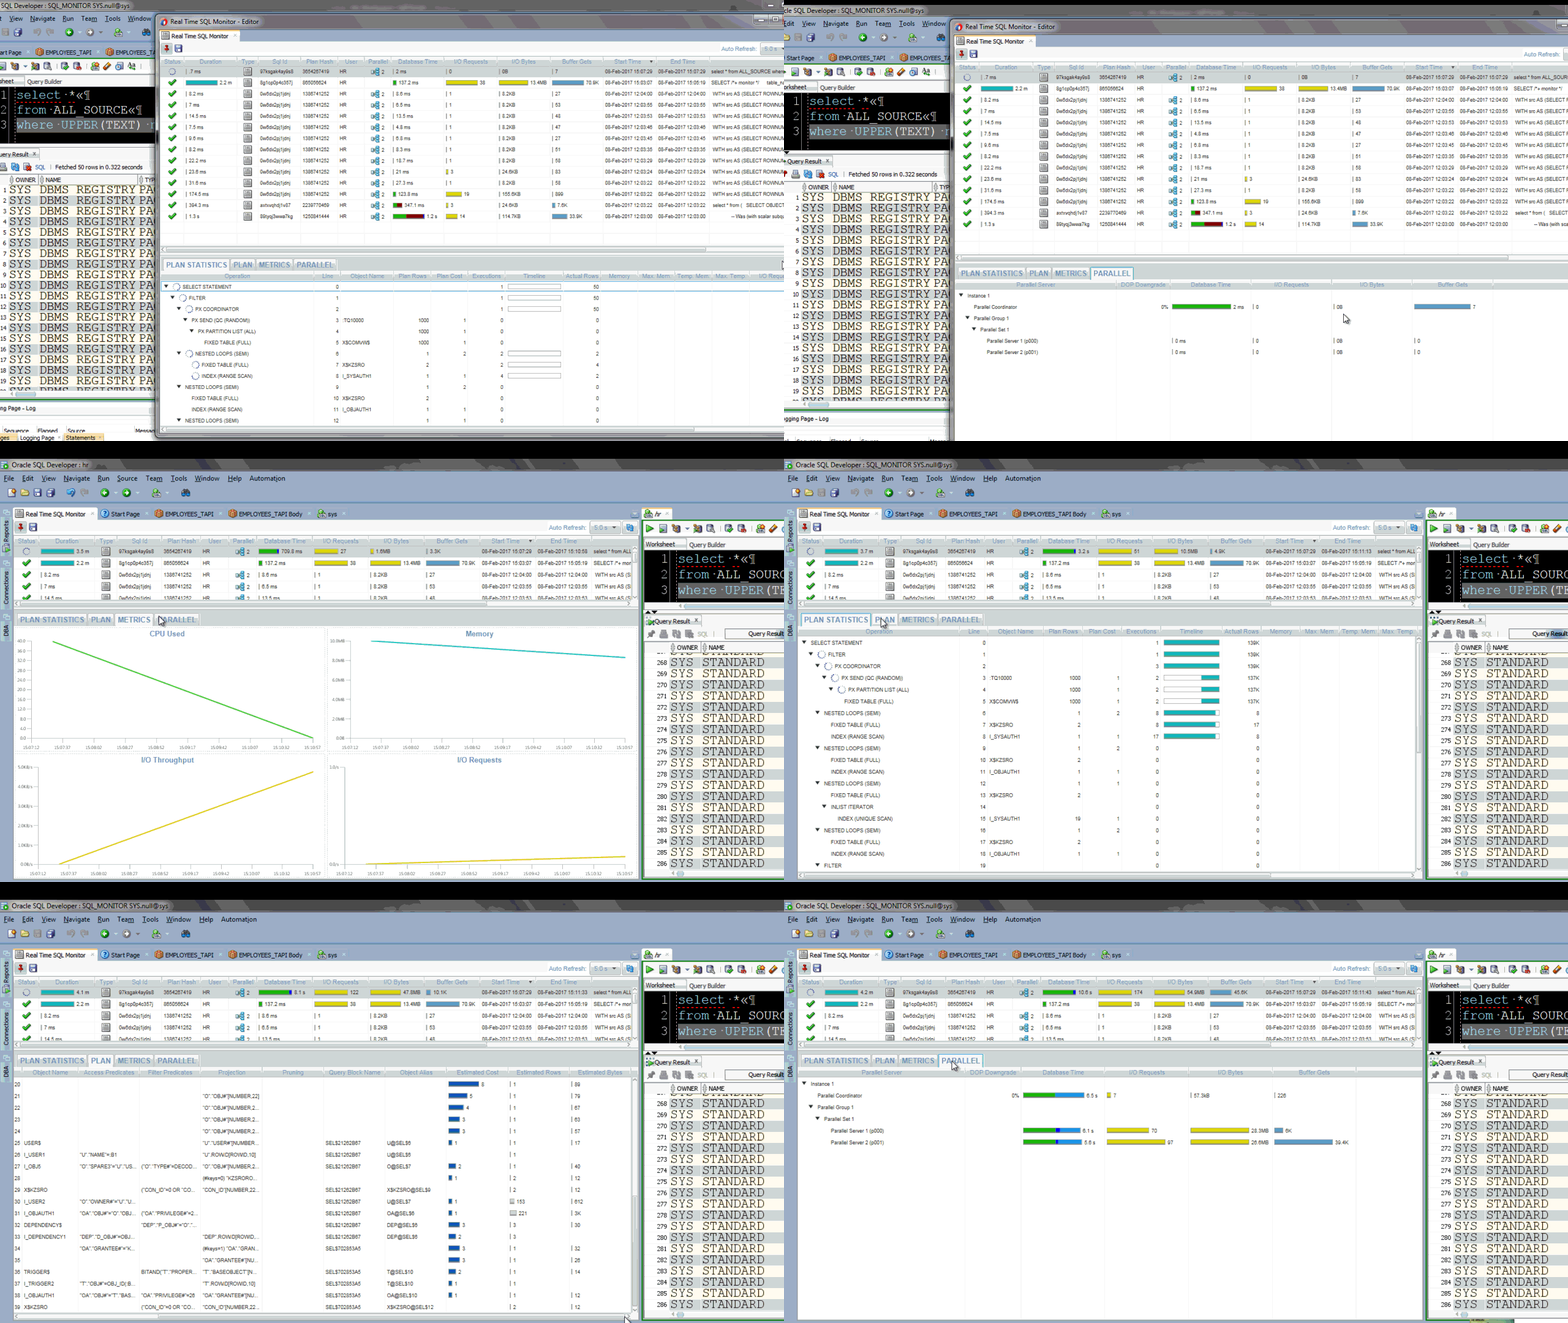
Long story short: Too late or too lazy to start a trace on a poorly performing query? Want to know what is going on while it is running? Simply fire up Real-Time SQL Monitoring. Now you can see what steps of the execution plans are running, how much CPU is being consumed, top wait events, number of rows processed per step (expected vs actual!), and a whole lot more.
Before you waste a lot of precious time with your fancy reading and such, go play with this interactive report RIGHT NOW.
I’ll take a second to pick on someone I respect (I only pick on the people I really like), who was complaining that SQL is not something you can debug. Well with this feature, it feels like you can!
Here’s what it looks like

A Trick for Seeing This for All Your Queries
It’s possible that you don’t live in the real world where you have queries that take many minutes or hours to execute. If you want to fire up a monitring session for a query that runs relatively fast, just use the /*+MONITOR*/ Hint.
This Hint tells Oracle (assuming you have the Tuning pack features enabled) to make real-time monitoring for the query available, even if the query isn’t still running. (docs)
Example:
SELECT /*+MONITOR*/ t.table_name, USER AS owner, t.cluster_name,
       t.partitioned, t.iot_type, t.tablespace_name,
       t.last_analyzed, ROUND (t.num_rows) num_rows,
       t.TEMPORARY, t.table_type, t.table_type_owner, t.NESTED,
       DECODE (   NVL (tablespace_name, 'x')
               || UPPER (partitioned)
               || NVL (iot_type, 'x')
               || TO_CHAR (pct_free),
               'xNOx0', 'YES',
               'NO'
              ) is_external,
       t.dropped, t.initial_extent
  FROM SYS.user_all_tables t
 WHERE 1 = 1;

Thanks to Kris for pointing this out to me yesterday.
SQL Developer Reports
While Kris had my attention, he also pointed out a nifty feature that allows the trouble-shooter to send over a very detailed analysis report to the person who wrote the offending SQL statement. Play with the SQL Monitoring Report It’s interactive, don’t be afraid to click around in it!


4 Comments
Hi
Sometimes my customer encountered errors when execute materialized view refresh:
such as this:
exec dbms_mview.refresh(‘MV001’);
I changed it to
exec /*+MONITOR*/ dbms_mview.refresh(‘MV001’);
But sql monitor does not record this. Is there any method ?
Best Regards
Jian
You can also generate the HTML from the CLI, which may be useful to automating the process for testing etc:
select
DBMS_SQLTUNE.REPORT_SQL_MONITOR(
session_id=>sys_context(‘userenv’,’sid’),type=>’HTML’,
report_level=>’ALL’,sql_id=>:this_sql_id) as report
from dual;
In 11gR1 you only get static HTML, not the fancy Flash stuff.
Ref: http://download.oracle.com/docs/cd/B28359_01/appdev.111/b28419/d_sqltun.htm#sthref8077
Knowing how to make the DBMS package calls really opens up a lot of doors for automation. However I find that getting people to recognize and use the tools is a big first hurdle. And after that, maybe 15% of those people take it to the next level with automation. Those 15% are the folks you want working for you though!
Thanks Robin for the excellent tip and giving us another reason to upgrade to 11gR2!
Pingback: How Many Rows will my Query Return?