I’ve already discussed how the Rebel scum go about figuring out what’s wrong with their code. Now I want to get into the nitty-gritty details of how to start a debug session in SQL Developer. There are some prerequisites, but I promise it won’t take but a few moments to setup.
Ensure that
- you have been granted the DEBUG CONNECT SESSION priv
- you have EXECUTE privs on DBMS_DEBUG_JDWP
- you have EXECUTE privs on the object you want to debug
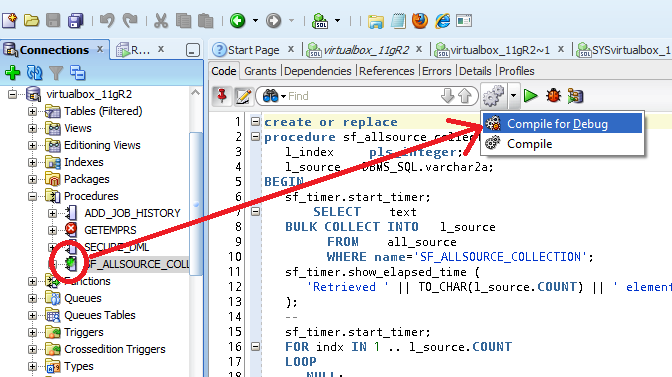
Once you have done ALL of that, you only have one more thing before you actually start debugging. It’s time to COMPILE our PL/SQL object WITH DEBUG. If you do not perform this step, you may find that your breakpoints aren’t honored and that your watches don’t actually watch anything. To compile with debug information, just do this:

Oh, I almost forgot to remind you – you have a test/dev environment, right?
You want to mind having any objects compiled for debug in your production environments. It adds a bit of nasty overhead and will impact performance. It won’t show up when you are running it, but if your app is calling it a few hundred times a minute, it will stack up on you in a hurry. So, if you see the little green widget next to any of your PL/SQL objects in production, just be sure to compile it again to remove it.
Alright, you have all the privs, you have compiled for debug, and you’re in a nice, safe, & cozy place to debug (not PROD! Ok maybe sometimes PROD). You are just one or two clicks away.
There is a ‘debug’ button you could hit, but don’t do that yet!

Let’s say you DO hit that button. You might be a bit disappointed. You see, the default behavior of the debugger is to run until it hits a breakpoint or an exception. But, we haven’t set any breakpoints yet! If you do this, it will indeed start a debug session and run your program. But, it will also finish and you won’t really see much of anything except for the normal output of your program.
So instead, I want you to open the Preferences dialog under the Tools menu, and go to the Debugger page. Find the ‘Start debugging option’, and change it to ‘Step Over.’
Once you do that, you’ll find that the program is sitting at the first line of executable code waiting for you to take over.
Just one more thing
Before the debug session begins, you’ll see a dialog that looks EXACTLY like the ‘Run PL/SQL’ one. You will need to input any required IN parameters. In addition if you want to debug a package member, be sure you actually select the right target.
And that’s about it for STARTING your debug session. There’s actually another way to start a debug session from OUTSIDE of SQL Developer, but I’m going to save that for another episode. I may even do it in IMAX 3D so I can start to recoup some of these production costs…step over versus into, watches, breakpoints, call stack, etc will be covered in the upcoming post as well.


31 Comments
Could you help me here?
ORA-01031: insufficient privileges
ORA-06512: at “SYS.DBMS_DEBUG_JDWP”, line 68
ORA-06512: at line 1
This session requires DEBUG CONNECT SESSION and DEBUG ANY PROCEDURE user privileges.
Process exited.
I’ve given all 3 privileges but still i get to see above error.
grant debug connect session to ;
grant debug any procedure to ;
GRANT EXECUTE ON DBMS_DEBUG_JDWP TO ;
[email protected]
Hi Jeff,
sorry for the late reply. I could fix this and able to debug now. It’s McAfee firewall created lot of problems and finally turned that off to make it work.
excellent, remember i’m just an email or chat away at jeff.d.smith
Hello Jeff
In our company, we are working with SQL Developer 4.1, and some users wants to use a Debugger. The case is: they have a package and they have 1 cursor (for icur in cursor loop), this cursor have 50.560 rows, so, some users want to go at row 1500 because in this row the icur.ID=30500 and the icur.NAME=’ROCIO’. But we cant to do that. Please tell us, how can do it.
set a breakpoint with a passcount that will have the cursor loop stop at the appropriate point
Jeff
This is my first step that you says. I put the break poing (in) cursor and (after) cursor on another variable, but never stop when I use modify value, or inspector or watched.
I need the debug stop when cursor arrived to row 1500. In PL/SQL Developer, I put a value example: icur.ID=30500 and the cursor stop in this value and I continue debugging.
I hope your answer
I hope your answer
The URL, I see: http://www.oracle.com/webfolder/technetwork/tutorials/obe/db/11g/r2/prod/appdev/sqldev/plsql_debug/plsql_debug_otn.htm
AND
http://www.thatjeffsmith.com/archive/2011/12/debugging-plsql-with-sql-developer-episode-iv/
Jeff
This is my first step that you says. I put the break poing (in) cursor and (after) cursor on another variable, but never stop when I use modify value, or inspector or watched.
I need the debug stop when cursor arrived to row 1500. In PL/SQL Developer, I put a value example: icur.ID=30500 and the cursor stop in this value and I continue debugging.
I hope your answer
show me your breakpoint or watch with break condition
there was a bug where the variables were being treated as case-sensitive so you might be getting tripped up by that
I followed Mr. Balda’s post but still could not connect.
The following DID work in my case.
A simple SQL Developer preference was set in the debugger. When it was time to debug, a prompt appeared asking for the IP address… Easy!
http://www.dba-oracle.com/t_ora_30683_failure_establishing_connection_to_debugger.htm
Hi Jeff,
When I try to pick a target procedure to debug the dialog only shows one possible option. It doesn’t show the proc I wanna debug. When I right click on the proc I wanna debug the only option is ‘Order members by’.
The package spec is:
procedure main;
function get_max_eff_term_code (the_table varchar2, sbgi_code varchar2, mysubject varchar2, coursenum varchar2, myterm varchar2) return varchar2;
PRAGMA RESTRICT_REFERENCES (get_max_eff_term_code, WNDS);
The only target option is get_max_eff_term_code.
The target I want to debug is main().
Any hints?
Thanks
I dunno except that it works for me?
Check the View > Log > statements panel. We run this to get the list of package members for debugging:
SELECT DISTINCT A.OBJECT_NAME, A.OVERLOAD, A.OBJECT_ID
FROM SYS.Dba_ARGUMENTS A, SYS.Dba_OBJECTS B
WHERE A.OBJECT_ID = B.OBJECT_ID AND
B.OWNER = 😡 AND B.OBJECT_NAME = :y AND B.OBJECT_TYPE = :z
Hi Jeff,
I’d like to understand the mechanics of the debugger getting launched but breakpoints not being hit so that I can solve my problem.
Packages are compiled with debug. I believe that all of the permissions needed are granted.
I am experiencing similar behavior to this: https://community.oracle.com/thread/2498760, regardless of if I use the same user, but different session to:
a) log in with sql developer for the listener
b) executes the task on the db.
remote debug, or normal debug?
breakpoints are honored when:
+ the unit has been compiled with debug
+ the breakpoint is set on a executable line of code
Remote debug.
do the breakpoints work on a local debug session?
are you using the same user for both connections as noted in the community forum post?
Sorry, both have been done, but the debugger just launches and then ends. The points are never hit.
I have not tested the exact same breakpoints, as the hidden state is too large to generate by itself, but I have a simple example where I can execute the ‘standalone debug’ (the little bug icon) by itself and the breakpoint is hit.
>>Comment: Sorry, both have been done, but the debugger just launches and then ends
Tools > Preferences > Debugger > Start Debugging Option: Set Over
Now debug again, and step through your code.
My guess is that your breakpoint is in a code section that’s never actually reached.
>>>>
>>Comment: Sorry, both have been done, but the debugger just launches and then ends
Tools > Preferences > Debugger > Start Debugging Option: Set Over
Now debug again, and step through your code.
My guess is that your breakpoint is in a code section that’s never actually reached.
<< launch debugger
breakpoint > assign variable
breakpoint > function call
breakpoint > loop
There are no conditions inbetween.
Then something is borked. You should see the anon block we use to start the debug session, where you would then step into the actual unit to be debugged.
Hmm, I wrote a nice long reply. Somehow it got destroyed. Essentially, I call the debugger and have breakpoints set on the debugger call and the next X lines, there are no conditions which would cause something to not get executed. For example, I had a call to the debugger in a loop and a disconnect at the end of the loop. I set breakpoints on everything in the loop and the disconnect. The system happily connected and disconnected the debugger, but never hit a breakpoint.
Re: the anon block. The system has so much hidden state that the anonymous block is just not feasible. It would be great just to call the function by itself.
Headed home. Thanks for the quick replies. I think that you are doing a great job for Oracle in general.
Sorry, both have been done, but the debugger just launches and then ends. The points are never hit.
are you even reaching the line of code the breakpoint is set on? if you step through the code, do you get there?
Yes, it is on the line after launching the debugger. After a few hours, I added at least 10 breakpoints to be sure that they are not on something that doesn’t work with a break. I have them on a loop, variable assignment, function call etc.
How this can be Run/Debug from SQL Developer.
create or replace
PACKAGE test_pkg_emp AS
TYPE t_number IS TABLE OF NUMBER INDEX BY BINARY_INTEGER;
TYPE t_varchar IS TABLE OF VARCHAR2(2000) INDEX BY BINARY_INTEGER;
FUNCTION inst_emp(P_EMPNO IN T_NUMBER,
P_ENAME IN T_VARCHAR DEFAULT CAST(NULL AS T_VARCHAR) ) RETURN NUMBER;
END test_pkg_emp;
create or replace
PACKAGE BODY test_pkg_emp AS
FUNCTION inst_emp(p_empno IN T_NUMBER,
p_ename IN T_VARCHAR DEFAULT CAST(NULL AS T_VARCHAR)
) RETURN NUMBER
AS
v_empno number;
BEGIN
FOR i IN P_EMPNO.FIRST..P_EMPNO.LAST Loop
insert into emp(empno,ename) values (p_empno(i),p_ename(i));
END LOOP;
SELECT COUNT(*) into v_empno FROM emp;
RETURN v_empno;
END inst_emp;
END test_pkg_emp;
From SQLPLUS this can be called as
DECLARE
v_eno test_pkg_emp.t_number;
v_ename test_pkg_emp.t_varchar;
V_No NUMBER;
BEGIN
v_eno(1):=9890;
v_eno(2):=9891;
v_ename(1):=’test1′;
v_ename(2):=’test2′;
v_no:=test_pkg_emp.inst_emp(v_eno,v_ename);
END;
/
http://www.thatjeffsmith.com/archive/2012/05/using-sql-developer-to-debug-your-anonymous-plsql-blocks/
Hi Jeff,
just experimented with the plsql debugger in sqldev. Really cool stuff!
There is 1 tiny mistake in the blogpost btw: you need execute privs on DBMS_JDWP_DEBUG.
regards,
Tony van Esch
We’re both wrong, it’s actually dbms_debug_jdwp, but good catch!
Pingback: Debugging PL/SQL with SQL Developer: Episode IV