Sometimes you need more memory.
Here’s an example: you want to model a database that has 1500 tables in it. What would that even look like?
If you zoom out far enough…
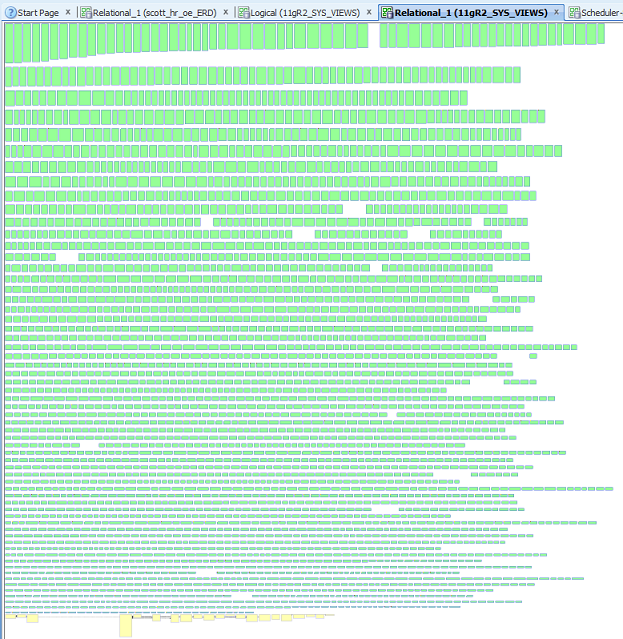
Now, ‘large’ is a subjective term. But lets put it this way – if you’re dealing with more than several hundred tables or entities – that’s larger than most other designs.
Oracle SQL Developer Data Modeler, and the modeling extension that runs inside of Oracle SQL Developer, consume a lot of resources to render the diagrams. Also, each model artifact is stored in its own XML file. That’s all loaded into memory when you open a design.
So, if you’re gonna work with a ‘large’ design, you’re going to need more memory than you get ‘out of the box.’
SQL Developer is a Java Swing application. It requires the JDK. There are several Java Virutal Machine (JVM) directives that tell it how to behave.
You can see how SQL Developer has configured its JVM settings and monitor its memory usage using a cool program called ‘Java VisualVM.’ It’s in your JDK/bin directory as jvisualvm.exe. If you open it and attach to the sql developer process ID, you get to see a lot of cool stuff.
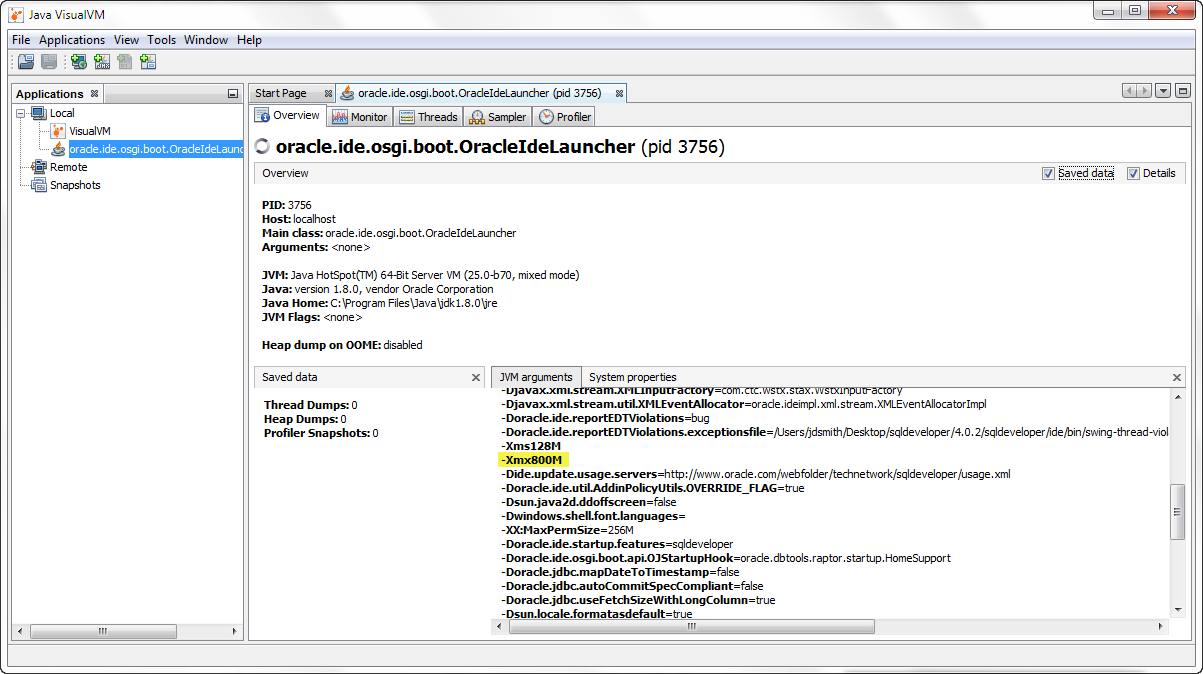
Like, how much memory SQL Developer is ACTUALLY using – by the way, Windows Process Explorer will lie every time.
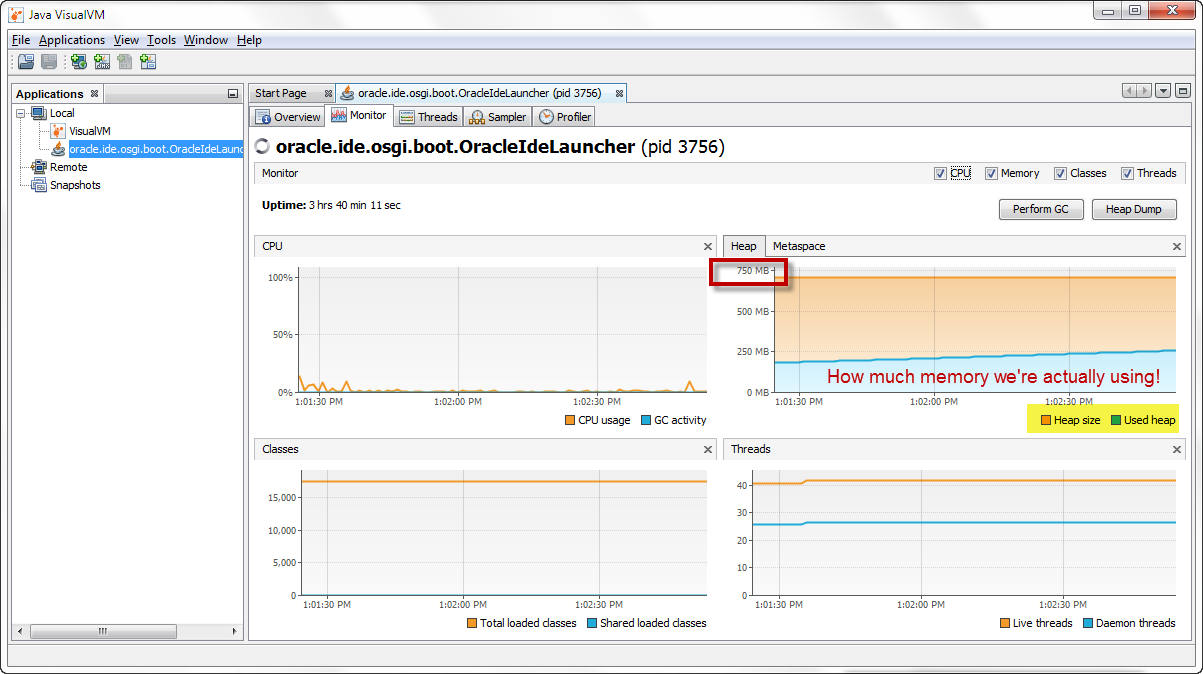
In older versions of SQL Developer, these were stored in the sqldeveloper.conf file in the bin directory – for Windows.
In versions 4.0 and higher, this is now stored per user in Windows.
For the Data Modeler, you want to find this file
C:\Users\jdsmith\AppData\Roaming\Oracle SQL Developer Data Modeler\4.0.2.840\product.conf
The italicized bits will vary per machine and version you’re running – but this should get you close.
You want to open the file with the application closed.
Edit the last bit
If you are getting the 'Low Memory Warning' Message Dialog while running
# the product, please increase the -Xmx value below from the default 800M to
# something greater, like 1024M or 1250M.  If after increasing the value,
# the product is no longer starting up because it fails to create a virtual
# machine, then please reduce the modified -Xmx value, or use a 64bit JDK
# which allows for very very large value for -Xmx.
#
# You can specify one value for any JDK using AddVMOption, OR you can specify
# separate values for 32-bit and 64-bit JDK's.
#
AddVMOption -Xmx800m
# Add32VMOption -Xmx800m
# Add64VMOption -Xmx800m
In particular the last bit. Instead of 800 megs of RAM, go higher like 2048. You should be pretty set at this point for even your really large designs. Don’t have that much memory to spare? Then you need a proper design and engineering machine.
Or just work with smaller designs.
And of course when you’re dealing with models that have so many objects, you really want to get familiar with SubViews.
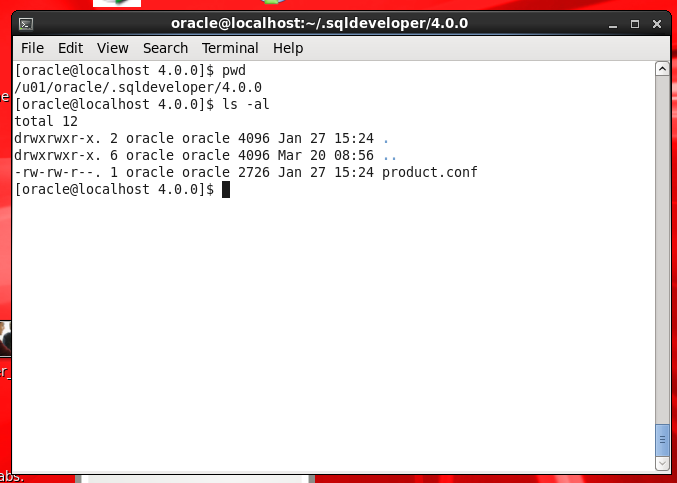
If you’re not in Windows, this information is stored in your $HOME directory, in a hidden ‘.’ subdirectory.
For *NIX and Macs, look here’ish: $HOME/.sqldeveloper


22 Comments
When working with xmldb and crossjoins even 2GB of Xmx memory is not enough and users run into javaheapspace errors.
How, can users start the garbage collection or flush the memory?
So give them 4 or 5GB, or don’t use crossjoins or use better where clauses?
You can use various JVM GUI tools to force garbage collection on demand (button click)
I use ubuntu, how can I make this adjustment?
same way – the file is just in a different place. in your OS user home directory, there will be a .sqldeveloper directory under it – the xml files will be in there.
thank you very much
Thank you very much. It’s been an excellent explanation
It works. I am merging 2 relational models with 1,800 and 1,500 tables. It was running VERY slow. I noticed Windows7 Task Manager reporting around 1Gb of private memory and no more. (I don’t have ‘Java VisualVM.’). When I added this to my “C:\Users\loginuser\AppData\Roaming\sqldeveloper\17.2.0\product.conf” file, the merge ran quickly and Task Manager now reports 1.5Gb of private memory for SQL*DeveloperW.exe.
“AddVMOption -Xmx2048m”
Thanks Jeff!
No worries Duane. The dev manager tells me he usually runs at 3 or even 4 GB of RAM because his models are even larger. Glad you found a good setting for you!
I have SQLDeveloper 4.1.0 running with 64-bit JDK 8.0.45.
It suddenly freezes while I am in the middle of modifying a stored procedure. I thought this might be caused by the VM running out of memory (although I have not seen it using more then 390M in Task Manager).
Therefore, as suggested in the article, in the file C:\Users\\AppData\Roaming\sqldeveloper\4.1.0\product.conf I changed the default -Xmx value from 800M to 2048M uncommenting the AddVMOption and setting it as -Xmx2048m.
After restarting SQLdeveloper, visual VM still shows it set to 800M. I also tried modifying Add64VMOption tii ni avail.
Am I using the wrong product.conf file?
More importantly, has anyone experienced SQLDeveloper 4.1’s freezings?
Thanks.
I changed both values mentioned to 4096 hoping to improve performance for a query expected to return almost 300k rows (being done for sizing purposes). There is no change in SQL developer performance.
Having access to more memory won’t make queries run faster. What exactly are you trying to fix?
What’s the purpose of giving SQL Developer access to more memory?
I was trying to improve the performance of a query. Maybe I need to change the SGA instead?
>> was trying to improve the performance of a query. Maybe I need to change the SGA instead?
Step one, figure out why the query is taking a long time.
Also, when you run a query, we just grab the first 50 rows. Is it taking a long time to get that first 50 rows to show up? Or is it taking a long time to fetch down the 300,000+ records to the grid? If the latter, then memory for SQLDev might be what you need. But I would also ask why would you want 300,000+ rows in a grid to begin with.
“Windows Process Explorer will lie every time”? Really? Don’t you think such a bold claim deserves proportionately substantial explanation?
Probably.
Do you routinely see Windows accurately reporting the amount of memory actually being used by a Java process vs what JVisualVM shows? Memory grabbed by the jvm vs what’s being actually used by the program is the point of contention here…regardless, I’m seeing much better performance with Java 8 and our latest builds. Using any version of Java on an old OS like XP though isn’t going to be very good.
Process Explorer is accurately reporting the amount of memory the VM has taken from Windows.
Your claim that “SQL Developer is using way less memory than Windows thinks it is” isn’t accurate. SQL Developer has asked the VM to allocate the memory from Windows, and Windows has an accurate tally of that allocation. If the application has allocated memory that it isn’t actually using, that’s a problem with the application, not Windows’ reporting of that application.
PE has no insight into whether the VM, or any other application running on the system) is actually using that memory. If the VM isn’t efficient at using its memory reservation, that’s a problem with the VM — not a “lie” that Process Explorer is telling.
Windows expects applications to only allocate memory that they actually use, and as such provide no mechanism for reporting allocated but arbitrarily unused memory to the OS. Linux doesn’t do this either — I don’t know of an operating system that does. After all, what would be the point?
What the JVM has received from the OS and what the application are using are two different things. When we’re done with the memory, it goes back to the JVM, not back to the OS.
I call out Windows b/c 80%+ of our users are on that OS, and when they complain about SQL Developer using so much memory, I take exception to that.
Maybe it’s a circular argument of sorts, but garbage collection and Java in general have gotten so much better from Java 6 to Java 8 (and Java 9 is already in the wings) so I actually find this to be less and less relevant as we go forward.
Yes, the amount of memory Windows has allocated at the JVM’s request is a different figure than the amount of memory that the application in the JVM is actually using. Process Explorer reports the JVM’s allocation, and doesn’t lie about it. The JVM also consumes memory to store code, and that’s also not reported in the “heap” measurement you’re using for comparison.
Right, so maybe I should have been more clear. The application process is shown in task manager as using the memory even though the application itself is NOT using said memory, but the JVM responsible for serving said application IS. Fair?
Hi Jeff,
fyi, your ‘italicized bits’ in the path are not displayed correctly :-))
Neither in FF, Chrome nor IE..
Regards, Mark
Thanks Mark – my fancy dancy theme and the plugin to do the code markup stuff ain’t playing nice together 🙁 But it’s ‘fixed’ now, thanks!
That pretty much covered it. It would help if the JvisualVM could be added to the same folder in the SDDM download as well.