Someone asked, I have this cool report, how do I get the chart out of it? For now I’ve been taking screenshots.
So let’s look at how you can get your Report out to HTML (and a PNG.)
When I say HTML, I mean you have a SQL Dev report that’s generated by SQL Developer itself. I am NOT talking about DBMS_OUTPUT reports that you can use to physically print HTML3 code and have it render as HTML in SQL Developer.
The Report
Here’s a query I’ve used against my UNTAPPD data and turned into a not very good bar chart.
SELECT BEER, abv, COUNT(*) FROM hr.untappd
GROUP BY beer, abv
HAVING COUNT(*) > 5
ORDER BY COUNT(*) DESC
fetch FIRST 15 ROWS ONLY;
So top 15 beers I’ve tried, based on the number of times I’ve tried them. And, I wanted to know how strong they were, to see if there was any correlation. The correlation bit is hard to see via this type of chart, that’s why I say it’s not the best report for what I want to do.
Here’s the report as it renders INSIDE of SQL Developer.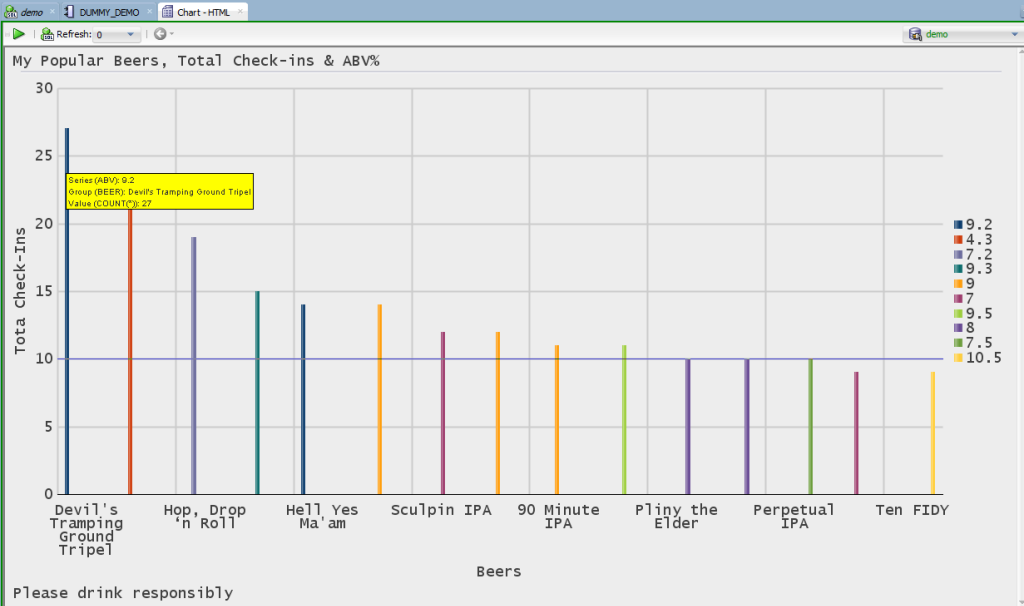
So, how can I get this out of SQL Developer, besides taking a screenshot?
Well, if you export it to HTML, it will also spit out a PNG of the graph itself.
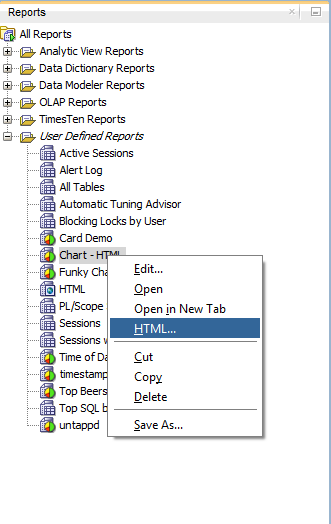
Then, where is it going to go?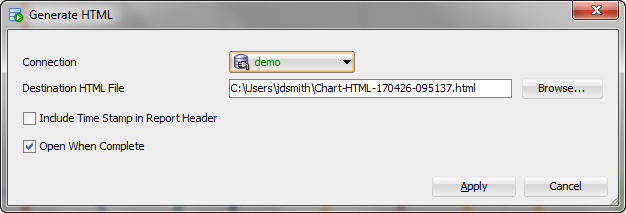
Ok, let’s go look at our report!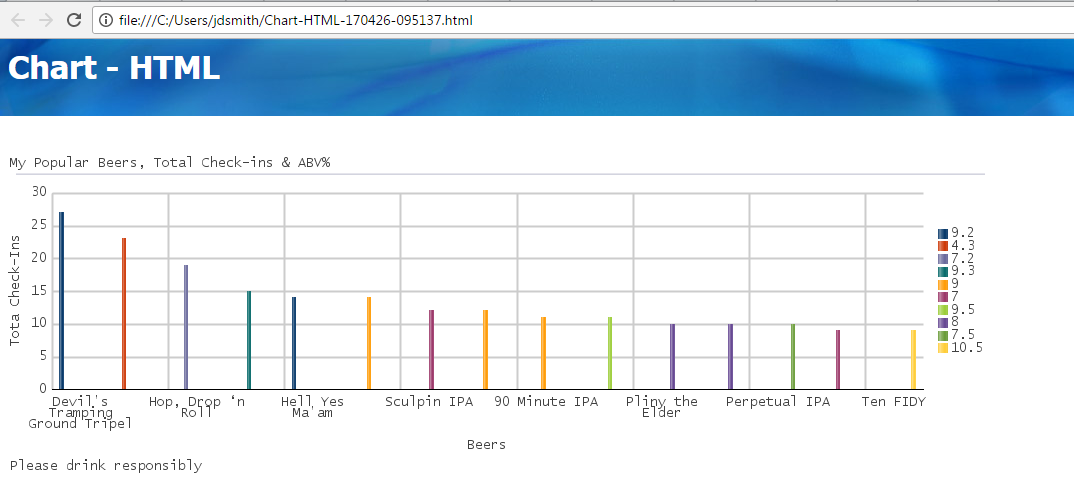
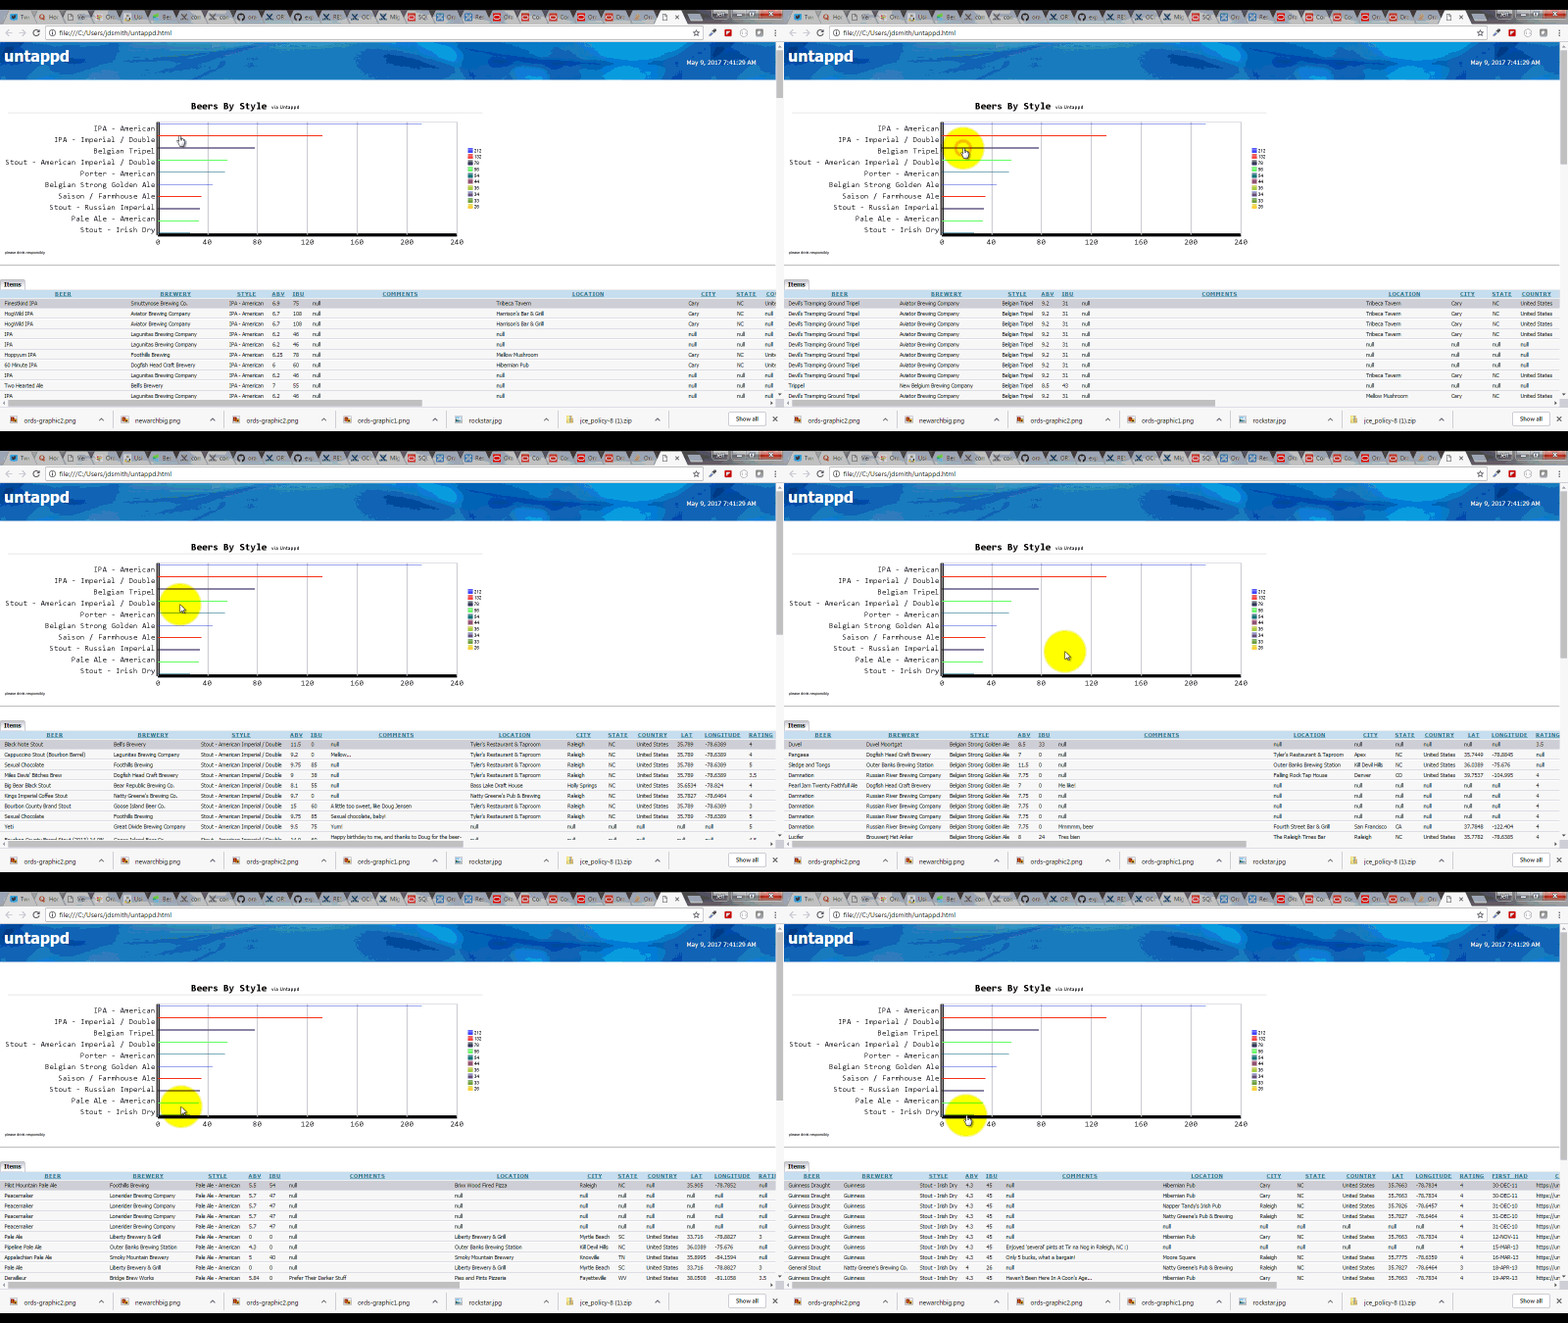
If you look at the HTML source behind your report, you’ll see the IMG tag and the chart PNG that was created. 
You can also get these out via the command-line.
Your interactive reports/charts will still work when exported to HTML 🙂
All this stuff I’ve just show you? Been in the tool since like version 1.5..give or take. I’ve said it before and I’ll say it again:
Reporting is the most powerful, least utilized feature in Oracle SQL Developer



2 Comments
Nice I’ve been using it since version 2 need to use them more often.
Love the new look of the site, feels fresh.
Thanks Yas! I got tired of the old look and figured a change couldn’t hurt.