You better run and catch it then!

You know you’re getting old when the new crop of kids don’t get this joke, or even worse, don’t understand what a prank phone call is.
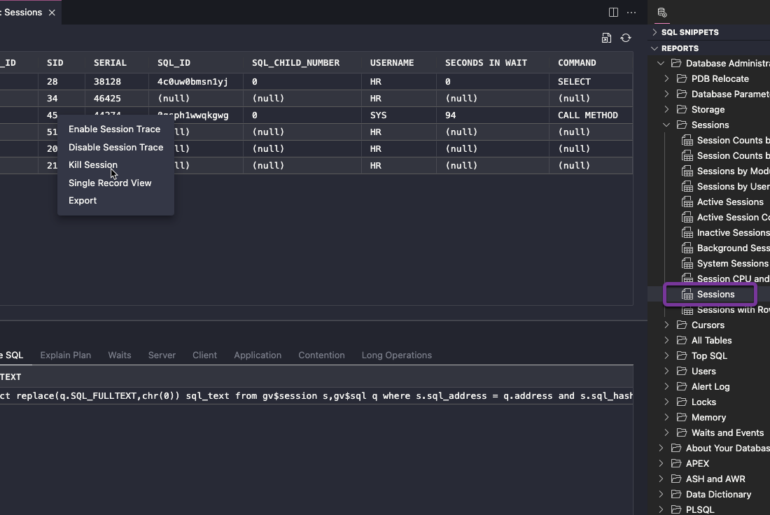
I’m pretty sure that folks still get phone calls from frustrated people who want to know how much time is left before their query will finish executing. You sit down and write what looks to be a pretty straightforward request for some data, and 12 hours later you’re still staring at the ‘Working, please wait dialog.’ Surely the server knows what is going on and can tell you when it’s safe to take a potty break?
I have been telling people for years that there really is no way to know, because the database isn’t giving up that information.
What I’ve been telling folks:
Some new troubleshooting tips:
Check the average run time for that query!
I was curious if SQL Server had any sort of instrumentation to make this puzzle a bit easier to crack, and the good folks at @SQLskills (Twitter) had a very simple bit of advice. Why not check to see if the query has been ran before, and if so, how long did it take last time? Actually, to quote them:
“If it’s a query plan that’s in plan cache, you could look at average execution time too”
The elegance and simplicity of this advice really make me take pause. I should have thought of that myself, especially as I’ve been dealing with this challenge for the better part of 10 years. I suppose I really wasn’t doing a good job of ‘thinking outside the box.’ Of course this solution isn’t a silver bullet either, but it is a REALLY good bullet. If the query is in the SGA, and if it’s ran more than once or twice, we can probably get a pretty good idea of how long it will take to run the next time – again assuming no outside interference in way of blocking locks.
So I spent just a few minutes querying that up, see below.
Another kind soul (Twitter) reminded me of Oracle’s new Diagnostic+Tuning pack feature for 11g called ‘Real Time SQL Monitoring’ (docs)
This feature allows you to dive into the execution plan as it executes. You can see what steps are actively running and how many resources are being consumed by each step. A great diagnostic feature that would help you tune the query after the fact by driving to the part of the query that is causing the performance issue. Alas, from what I can tell, it still doesn’t tell you how much time is left on your query.
Using this feature will license you for additional software over and above what you’ve already paid for your Enterprise licensing – please be careful using this in your production environments.
But even if SQL Server and Oracle DID tell you how much time was left, would you really believe it?
I appreciate that Oracle doesn’t publish release dates for their software because they don’t want to be liars. We all miss our dates. And I’m pretty sure the database engine would routinely miss it’s estimated time of completion schedule as well if it did calculate such a thing.
My Query to Find Average Execution Times
[sql]
SELECT V.SQL_ID,
SUBSTR (V.SQL_TEXT, 0, 50),
FLOOR ( ( (V.ELAPSED_TIME / 1000)) / V.EXECUTIONS) avg_time_msecs,
v.executions
FROM v$sqlarea v
WHERE V.SQL_ID IN
(SELECT v.sql_id
FROM v$sqlarea v
WHERE V.PARSING_SCHEMA_NAME = :parse_schema
AND v.executions > 1
AND v.elapsed_time > 0)
ORDER BY 3 DESC;
[/sql]

Note 1: Elapsed time is calculated in microseconds – my math tells me micros / 1000 = milliseconds – I THINK
Note 2: Only pulling in queries for X user, where it has executed more than 1 time, and where elapsed time is more than a few microseconds
Note 3: I’m using FLOOR because I don’t care about fractions of a milli-second
Note 4: This is quick and dirty, seeing it now, i’m thinking the SUBQUERY IN clause is completely unnecessary…


4 Comments
Pingback: My Oracle is broken, can you fix it? | 140,000 Characters or Less
Jeff,
If you do not want to spend money (or are still not in 11g) you can use Tanel Põders os_explain:
http://blog.tanelpoder.com/2008/06/15/advanced-oracle-troubleshooting-guide-part-6-understanding-oracle-execution-plans-with-os_explain/
It’s not that sexy or colorful, you will even need to have a good understanding what’s going on. But if your really want to know where your statement is at the moment, os_explain will tell you.
Wow, that’s pretty hard core. The people asking me for help with their long running queries would probably wonder why Tanel is speaking a foreign language 😉
That is seriously very cool though. We take a similar approach with our Performance Analysis for Oracle product at Quest –
Pingback: Tweets that mention Is Your Query Running? | 140,000 Characters or Less -- Topsy.com