Updated November 19. 2018
The ‘Holy Grail’ of software tools is the environment where things are made easy, but not at the expense of usability or simplicity. You use a tool because it makes something ‘easier’, but some software products are anything but.
SQL Developer is fairly scaled down. You have a few toolbars, several menus, and 2 driving windows – the Worksheet and the Browser. But what if it could be even simpler? SQL Developer is asked to be the database IDE. We serve many masters, yet a majority of our users simply look to the tool to be a GUI replacement of SQL*Plus.
What if you as a user could ‘slim’ down SQL Developer? Less menu items, fewer widgets to load? A leaner, meaner SQL Developer?
Well, you can do that today.
Disable Extensions: Versions 1 – 3.2
This question came up at my presentation at RMOUG, and I didn’t have a great answer. Fortunately my boss was there and he had a really good answer: simply go into the preferences and disable all the extensions.

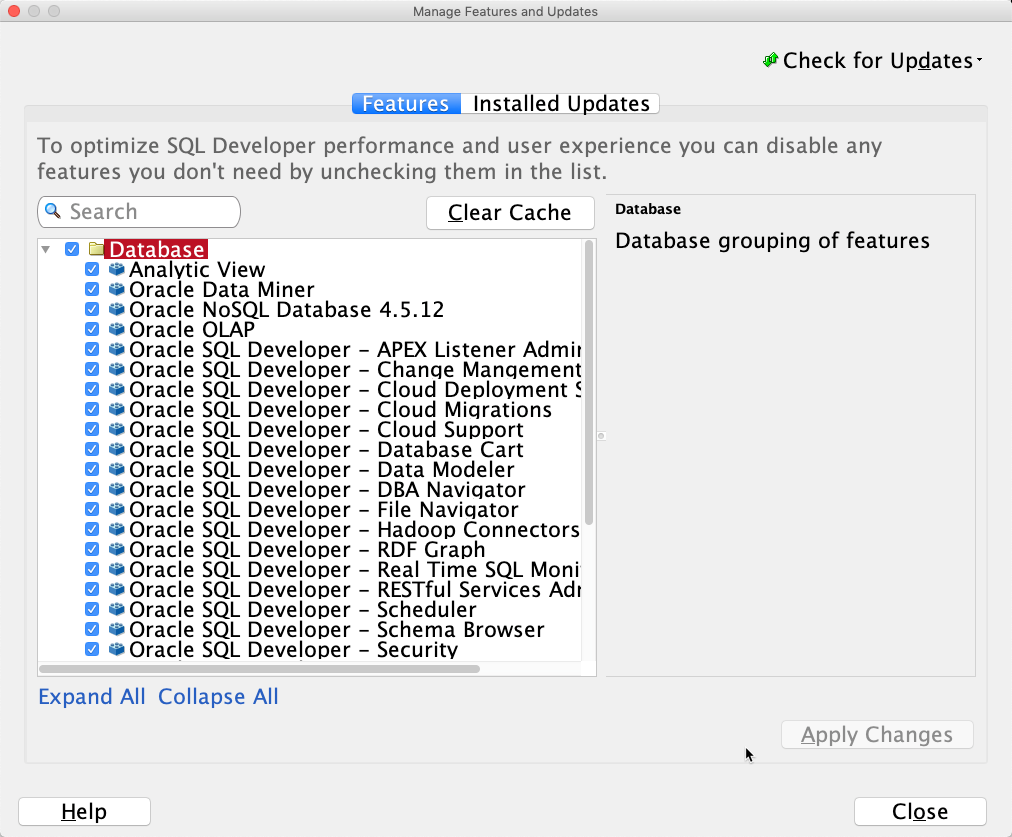
Disable Feature: Versions 4.0 and Higher
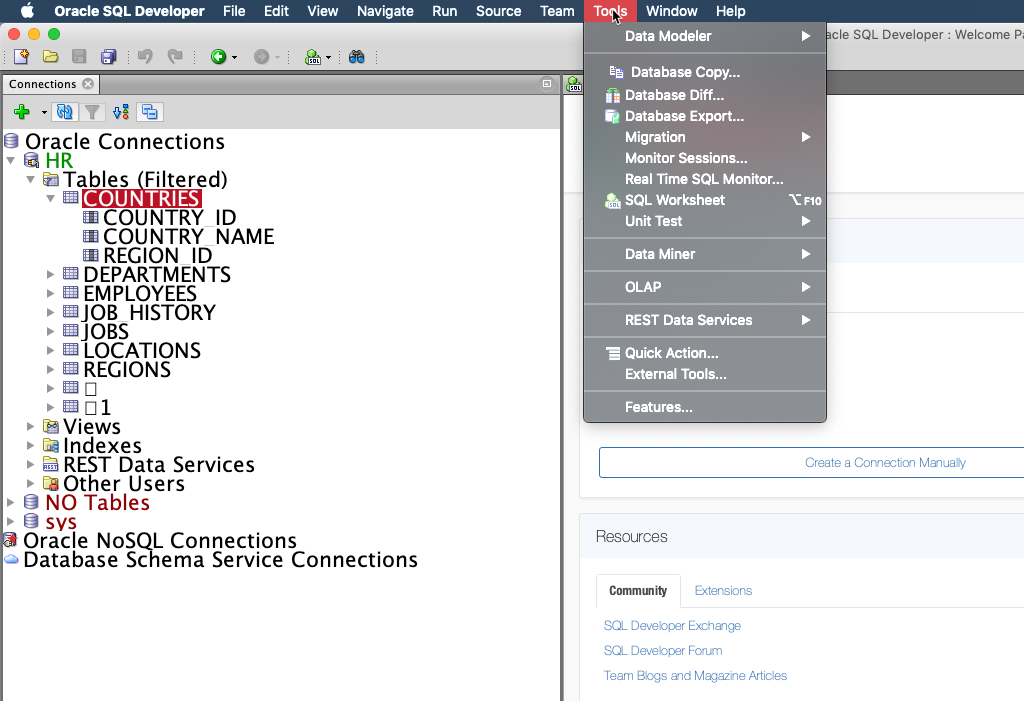
On the Tools menu, select ‘Features’ – and turn off things you don’t use. Like Migrations – this is a BIG feature that MOST of you won’t need to use.
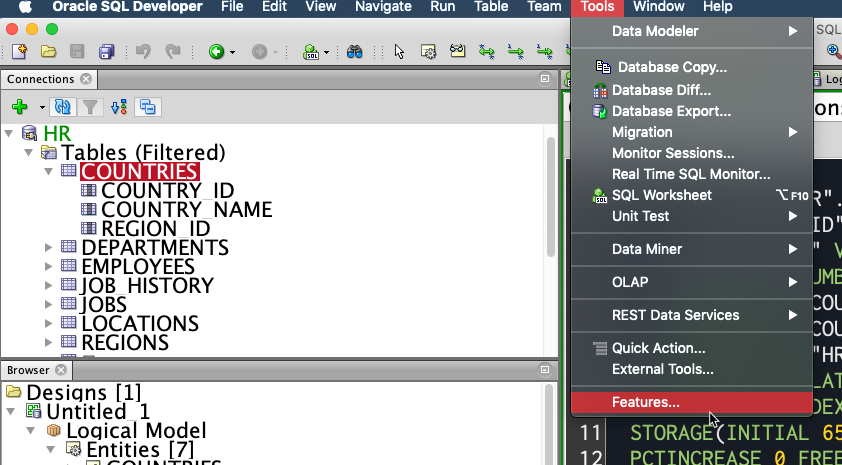
This looks quite a bit different than before, but it’s the same concept.
The Results
Once you make a change here you will need to re-start SQL Developer to make the changes take effect. You will see two primary advantages:
- Faster load time
- Simplified UI
Load Times
You should see a faster start time with disabled features – but it depends on your machine and how many of the ‘big’ features you disable. On my WIN7x64 machine SQL Developer is loading in about 17 seconds with everything turned on, and in 10 seconds with most things off including the Start/Welcome Page. I did leave on the Data Modeler, because I think folks like the ‘Model’ tab when looking at Tables, and that requires the Data Modeler extension.
For the primary benefit, you will notice the main menu items are skinnier – no items for Source Control, the Data Modeler, Migrations, or Data Miner. These are not ‘bad’ things, but chances are you rarely use these features. You can in fact turn them off (and turn them on, as required.)
On my Mac – I didn’t even try turning things off. I have like a 7 second load time with everything on.
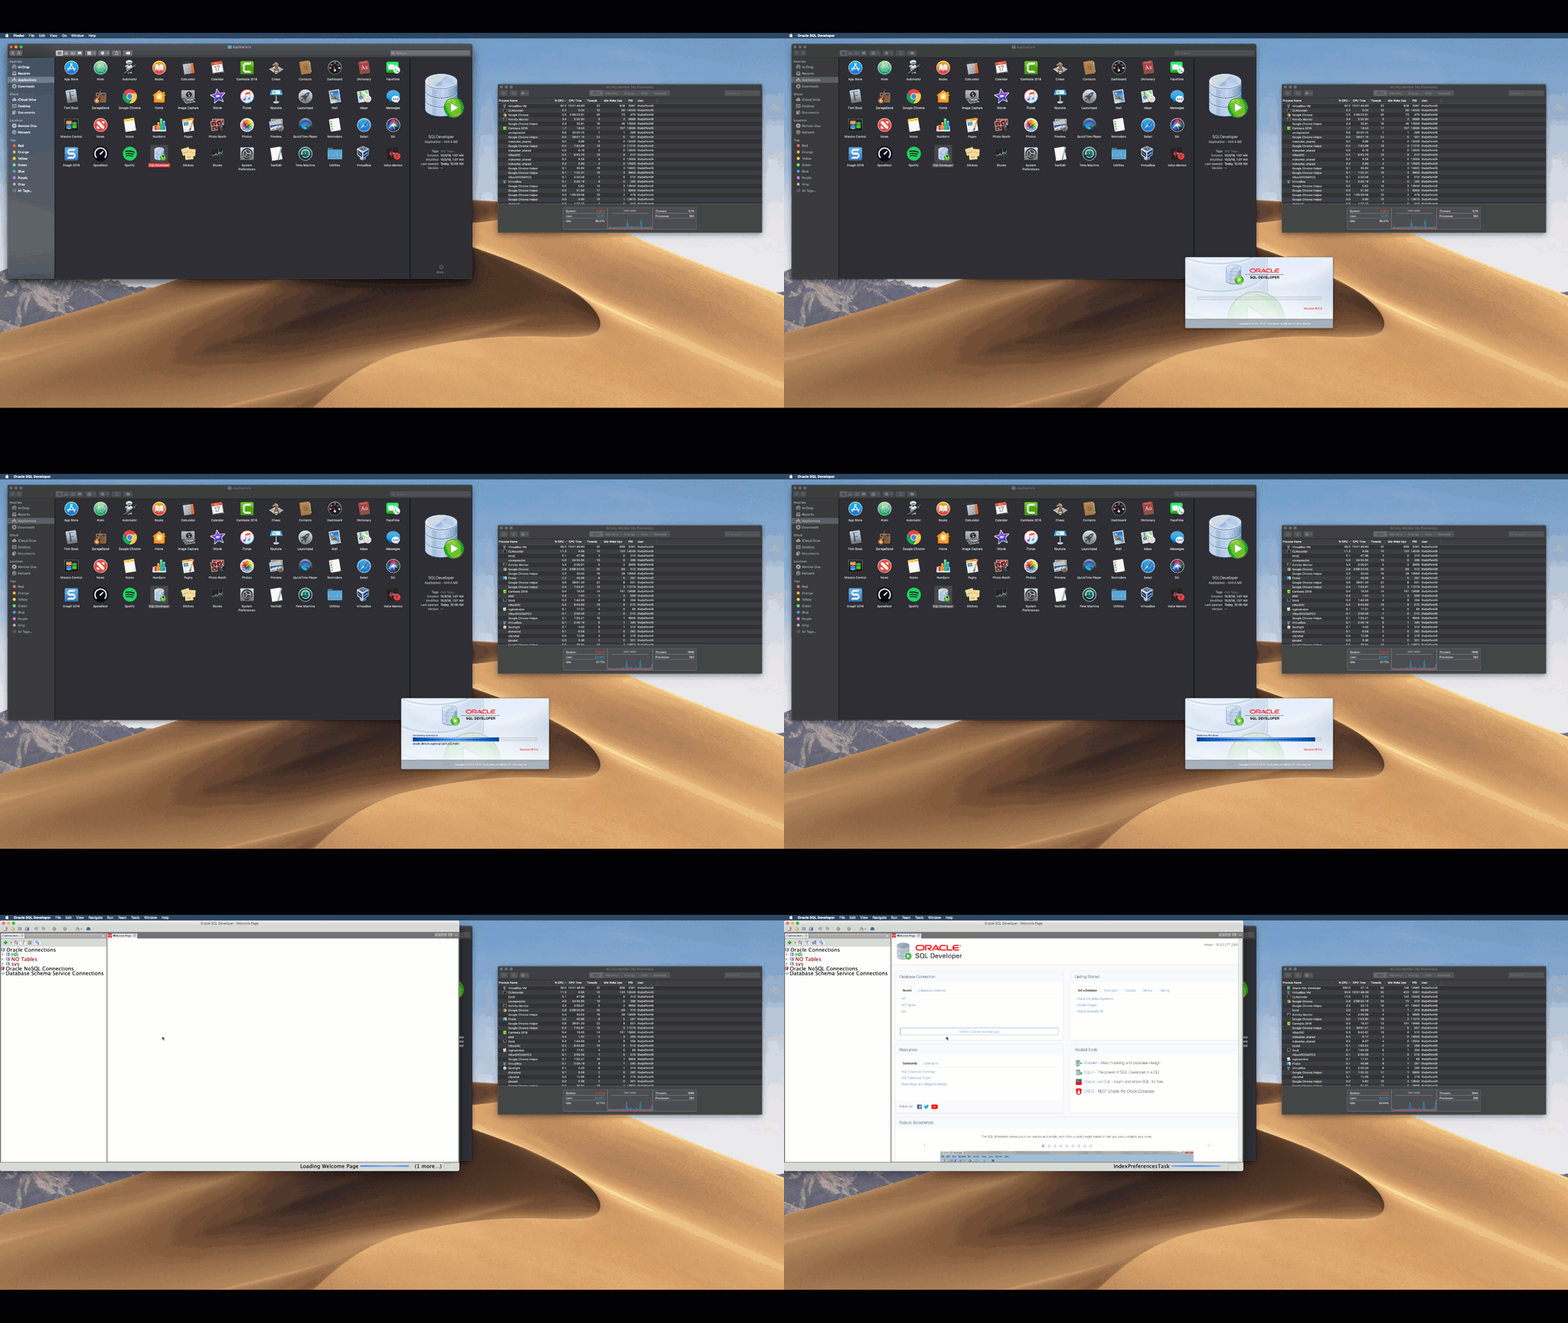
Simplified UI – ‘Lite’ Mode
Further Optimize Your SQL Developer Experience
There are a few more techniques and preferences you can exploit to get SQL Developer running faster and using less system resources. Note that I run SQL Developer ‘out of the box’ with no tweaks and it runs just fine. However what works for many people won’t necessarily be right for everyone. Here are a few changes you can make in a few moments to dramatically affect SQL Developer’s performance.
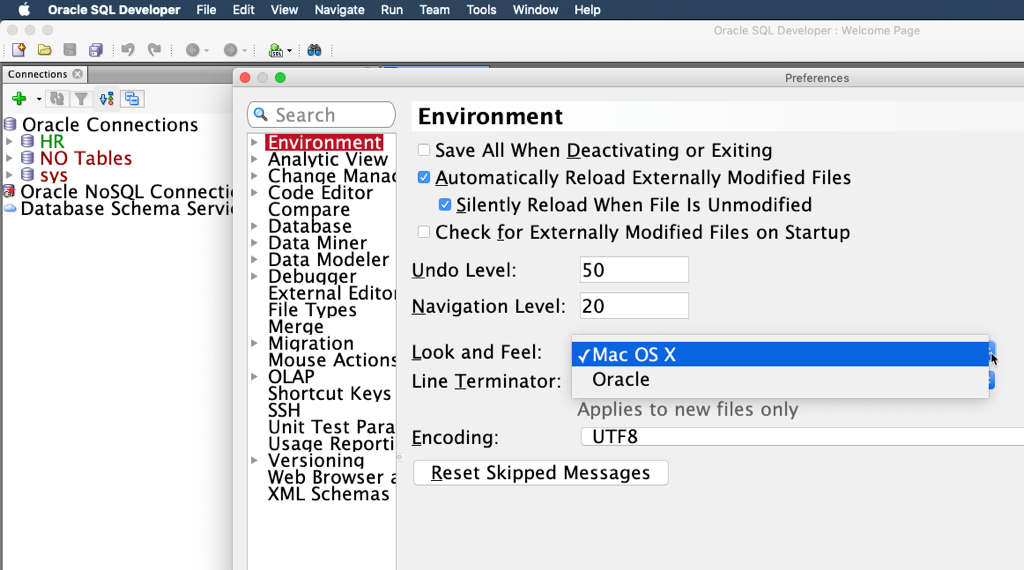
Set Look and Feel Preference to Host OS
Look and Feel is a Java property that controls how the application’s GUI ‘widgets’ are drawn and behave. You can let the host OS control this, or you can implement your own themes. SQL Developer ships with an ‘Oracle’ Look and Feel theme. I think it’s nicer than what Windows gives out of the box for Java applications.
BUT.
It costs more, CPU to be specific. It takes more work for the tool to run if it’s controlling the ‘look and feel’ instead of just farming that out to the operating system. Now the funny or weird part here is that I’ve heard a few OS X folks tell me they see the exact opposite behavior. So, if you see SQL Developer running slow or it chewing up the CPU, try switching this preference and restarting the application.
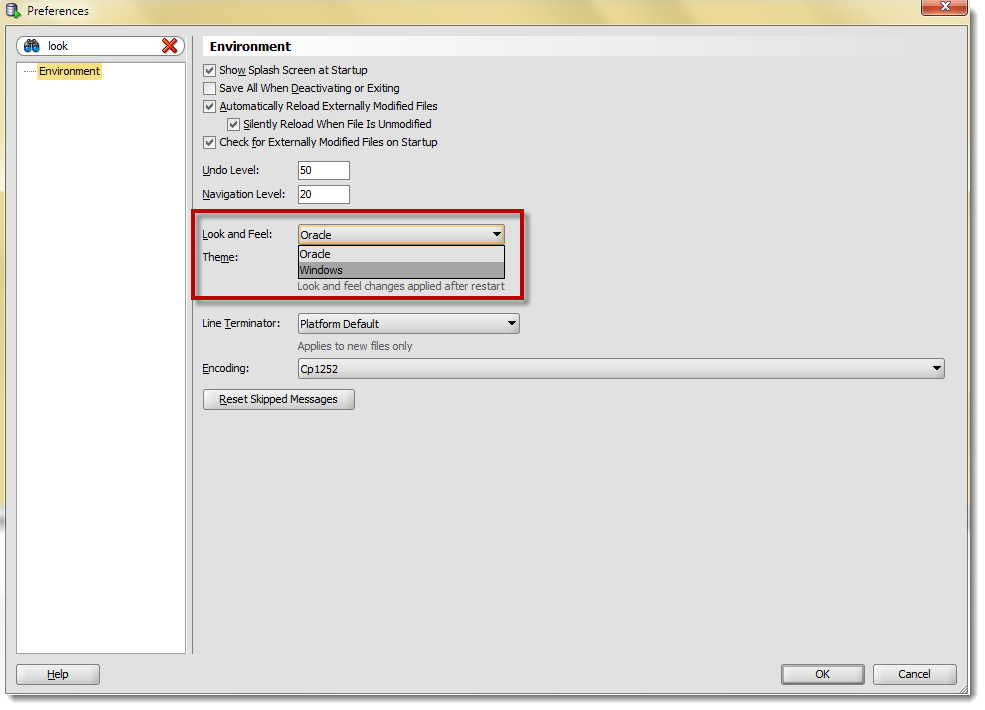
Or if you’re on a Mac
Close Grids and Files When You’re Done with Them
This is hopefully common sense. Having data loaded in a grid consumes memory. Lots of rows = lots of memory. Close the grids when you’re done. When you close a grid it forces the JVM to do garbage collection. This is fancy talk for saying that the java application will release memory back to the java virtual machine. This will also keep your DBAs happy – leaving grids open with un-fetched results (you queried a billion row table but only got the first page) leaves processes and other system resources tied up.
Don’t Set Your SQL History Limit to Some Obscenely High Value
Like 30,000. That’s too high. I think the default (100) is too low. Mine is currently set to 500. Just know that what you set it to affects memory. The SQL History data is read into memory at start up. The more you save, the more it costs.
Still Experiencing SQL Developer Performance Issues?
Drop me a line at [email protected] or leave a comment here. We’ll do our best to get your issue sorted out. Keep in mind I’ll ask you to try the above tips first, then ask you what version of SQL Developer you’re running and what JDK you’re using. Answers including anything BUT ‘Latest version and Oracle Java 8/1.8 JDK’ will be me replied with ‘try that and get back to me.’
With more than 5,000,000 active users today, Oracle SQL Developer is bound to be running in some environments that cause performance issues. We won’t be satisfied until everyone has a good of an experience with it as we do!



47 Comments
Hey Jeff,
My company is using SQL Developer Version 20.2.0.175 Build 175.1842 as a client terminal server and a couple of users connect to this tool, as many users connect memory usage of the server is going high. To reduce the usage I want to disable un-used features to all those users who are connecting the server.
So, Is there any config file that stores these features to enable/disable information?
Hi
I am new to sql developer . when I run the program ,it launches fast but when I am trying to connect to a connenction
(schema) and load it, the process is too slow. one time I wait for at list 15 minutes and at last it connencted but other times it stuck and the window of the program changes to black screen .
the version that I am using is 19.2
How far away is your database? We run many SQL statements when you make a connection.
19.2 is 2 years old, try 21.2
Hey Jeff, ive been breaking my brain trying to figure out how to speed up my SQL developer. Seriously, ive been uninstalling and installing back and forth irritated with the start-up speed. But your tips transformed my sql developer into Ferrari!! Love the remove the Extension feature.. All those unnecessary extensions hogged up my startup speed pretty well all these while..
Thank you again! you are a god of sql developer!
Rgds,
Gauthem
hey jeff,
i can’t find ‘Extensions’ in version 4
Everything changed in 4. For example, if you want to disable Migrations, you would do that in the Features menu item under Tools. But, it won’t speed things up much as version 4 doesn’t load extensions/jars until they’re needed (OSGi)
Hey Jeff,
I’ve been trying to find a solution for my scenario. I work in an environment that we have several hundred different database connections. I was able to get a script to convert my .ORA into an XML and import that into my connections and it worked perfectly. I cant say exactly how many connections I have but my .XML connection file is approaching 4mb. The problem I have now is that the first time I launch Developer and the first time a connect to a connection, both of those actions now take around ~3 minutes. When I was supporting closer to 30 connections my load time was nearly immediate so I doubt I have an environmental issue. Is there any way to speed up load time when I need this many connections or am I at the mercy of just something that is working as designed? Extra note, I have this many connections in case I need in on demand but I may only use 3-5 of the connections per day.
Thanks for any help in advance.
Be careful, playing with Look and Feel on certain versions of Windows may render SQL Developer unusable — which I just did 🙂
Here’s a helpful set of steps to reverse the Look and Feel customization: https://community.oracle.com/thread/3566180
Hi,
below is the trace file entry for the run of the a test, under the test we have four test implementation.
TKPROF: Release 11.2.0.4.0 – Development on Mon Sep 1 18:00:52 2014
Copyright (c) 1982, 2011, Oracle and/or its affiliates. All rights reserved.
Trace file: UTDB_ora_7487.trc
Sort options: default
********************************************************************************
count = number of times OCI procedure was executed
cpu = cpu time in seconds executing
elapsed = elapsed time in seconds executing
disk = number of physical reads of buffers from disk
query = number of buffers gotten for consistent read
current = number of buffers gotten in current mode (usually for update)
rows = number of rows processed by the fetch or execute call
********************************************************************************
The following statements encountered a error during parse:
SELECT 1 FROM DUAL WHERE dest.UTR_ID = src.UTR_ID
Error encountered: ORA-00904
——————————————————————————–
SELECT 1 FROM DUAL WHERE dest.UTIR_ID = src.UTIR_ID
Error encountered: ORA-00904
——————————————————————————–
SELECT 1 FROM DUAL WHERE dest.UTIAR_ID = src.UTIAR_ID
Error encountered: ORA-00904
——————————————————————————–
SELECT 1 FROM DUAL WHERE dest.UTIVR_ID = src.UTIVR_ID
Error encountered: ORA-00904
********************************************************************************
Error in CREATE TABLE of EXPLAIN PLAN table: sys.plan_table
ORA-01031: insufficient privileges
EXPLAIN PLAN option disabled.
********************************************************************************
SQL ID: 0hf85bfn1ujf5 Plan Hash: 374915200
select name,ut_id
from
ut_test order by 1
call count cpu elapsed disk query current rows
——- —— ——– ———- ———- ———- ———- ———-
Parse 1 0.00 0.00 0 5 0 0
Execute 1 0.00 0.00 0 0 0 0
Fetch 1 0.00 0.00 0 2 0 14
——- —— ——– ———- ———- ———- ———- ———-
total 3 0.00 0.00 0 7 0 14
Misses in library cache during parse: 1
Optimizer mode: ALL_ROWS
Parsing user id: 5
Number of plan statistics captured: 1
Rows (1st) Rows (avg) Rows (max) Row Source Operation
———- ———- ———- —————————————————
14 14 14 TABLE ACCESS BY INDEX ROWID UT_TEST (cr=2 pr=0 pw=0 time=68 us cost=2 size=756 card=14)
14 14 14 INDEX FULL SCAN UT_TEST_UK1 (cr=1 pr=0 pw=0 time=26 us cost=1 size=0 card=14)(object id 88700)
********************************************************************************
SQL ID: 56nmwb37tna1p Plan Hash: 418640185
select count(1)
from
ut_test_impl where ut_id = :ID
call count cpu elapsed disk query current rows
——- —— ——– ———- ———- ———- ———- ———-
Parse 2 0.00 0.00 0 0 0 0
Execute 2 0.00 0.00 0 0 0 0
Fetch 2 0.00 0.00 0 2 0 2
——- —— ——– ———- ———- ———- ———- ———-
total 6 0.00 0.00 0 2 0 2
Misses in library cache during parse: 1
Misses in library cache during execute: 1
Optimizer mode: ALL_ROWS
Parsing user id: 5
Number of plan statistics captured: 2
Rows (1st) Rows (avg) Rows (max) Row Source Operation
———- ———- ———- —————————————————
1 1 1 SORT AGGREGATE (cr=1 pr=0 pw=0 time=72 us)
3 4 4 INDEX RANGE SCAN UT_TEST_IMPL_UK1 (cr=1 pr=0 pw=0 time=60 us cost=1 size=111 card=3)(object id 88697)
********************************************************************************
select
CONNECTION_NAME
from
UT_TEST
where
UT_ID = :ID
call count cpu elapsed disk query current rows
——- —— ——– ———- ———- ———- ———- ———-
Parse 2 0.00 0.00 0 0 0 0
Execute 2 0.00 0.00 0 3 0 0
Fetch 2 0.00 0.00 0 4 0 2
——- —— ——– ———- ———- ———- ———- ———-
total 6 0.00 0.00 0 7 0 2
Misses in library cache during parse: 1
Misses in library cache during execute: 1
Optimizer mode: ALL_ROWS
Parsing user id: 5
Number of plan statistics captured: 2
Rows (1st) Rows (avg) Rows (max) Row Source Operation
———- ———- ———- —————————————————
1 1 1 TABLE ACCESS BY INDEX ROWID UT_TEST (cr=2 pr=0 pw=0 time=43 us cost=1 size=71 card=1)
1 1 1 INDEX UNIQUE SCAN UT_TEST_PK (cr=1 pr=0 pw=0 time=34 us cost=0 size=0 card=1)(object id 88624)
********************************************************************************
SELECT
T.UT_ID,
T.NAME,
T.CREATED_ON,
T.CREATED_BY,
T.OBJECT_NAME,
T.OBJECT_TYPE,
T.OBJECT_OWNER,
T.OBJECT_CALL,
T.COVERAGE,
T.CONNECTION_NAME
FROM
UT_TEST T
WHERE
T.UT_ID = :ID
call count cpu elapsed disk query current rows
——- —— ——– ———- ———- ———- ———- ———-
Parse 4 0.00 0.00 0 0 0 0
Execute 4 0.00 0.00 0 0 0 0
Fetch 4 0.00 0.00 0 8 0 4
——- —— ——– ———- ———- ———- ———- ———-
total 12 0.00 0.00 0 8 0 4
Misses in library cache during parse: 1
Misses in library cache during execute: 1
Optimizer mode: ALL_ROWS
Parsing user id: 5
Number of plan statistics captured: 3
Rows (1st) Rows (avg) Rows (max) Row Source Operation
———- ———- ———- —————————————————
1 1 1 TABLE ACCESS BY INDEX ROWID UT_TEST (cr=2 pr=0 pw=0 time=19 us cost=1 size=157 card=1)
1 1 1 INDEX UNIQUE SCAN UT_TEST_PK (cr=1 pr=0 pw=0 time=12 us cost=0 size=0 card=1)(object id 88624)
********************************************************************************
SELECT
S.STARTUP_ID,
S.INDEX_NO,
S.STARTUP,
SV.LIB_STARTUP_ID,
SV.LIB_STARTUP_NAME,
SV.LIB_STARTUP
FROM
UT_STARTUPS S,
UT_LIB_STARTUPS SV
WHERE
S.UT_ID = :UT_ID AND
S.LIB_STARTUP_ID = SV.LIB_STARTUP_ID(+)
ORDER BY
S.INDEX_NO
call count cpu elapsed disk query current rows
——- —— ——– ———- ———- ———- ———- ———-
Parse 4 0.00 0.00 0 0 0 0
Execute 4 0.01 0.01 0 0 0 0
Fetch 4 0.00 0.00 0 7 0 1
——- —— ——– ———- ———- ———- ———- ———-
total 12 0.01 0.01 0 7 0 1
Misses in library cache during parse: 1
Misses in library cache during execute: 1
Optimizer mode: ALL_ROWS
Parsing user id: 5
Number of plan statistics captured: 3
Rows (1st) Rows (avg) Rows (max) Row Source Operation
———- ———- ———- —————————————————
0 0 0 SORT ORDER BY (cr=1 pr=0 pw=0 time=55 us cost=4 size=1628 card=1)
0 0 0 NESTED LOOPS OUTER (cr=1 pr=0 pw=0 time=37 us cost=3 size=1628 card=1)
0 0 0 TABLE ACCESS BY INDEX ROWID UT_STARTUPS (cr=1 pr=0 pw=0 time=34 us cost=2 size=655 card=1)
0 0 0 INDEX RANGE SCAN UT_STARTUPS_TEST_IX (cr=1 pr=0 pw=0 time=28 us cost=1 size=0 card=1)(object id 88683)
0 0 0 TABLE ACCESS BY INDEX ROWID UT_LIB_STARTUPS (cr=0 pr=0 pw=0 time=0 us cost=1 size=973 card=1)
0 0 0 INDEX UNIQUE SCAN UT_LIB_STARTUPS_PK (cr=0 pr=0 pw=0 time=0 us cost=0 size=0 card=1)(object id 88640)
********************************************************************************
SELECT
T.TEARDOWN_ID,
T.INDEX_NO,
T.TEARDOWN,
TV.LIB_TEARDOWN_ID,
TV.LIB_TEARDOWN_NAME,
TV.LIB_TEARDOWN
FROM
UT_TEARDOWNS T,
UT_LIB_TEARDOWNS TV
WHERE
T.UT_ID = :UT_ID AND
T.LIB_TEARDOWN_ID = TV.LIB_TEARDOWN_ID(+)
ORDER BY
T.INDEX_NO
call count cpu elapsed disk query current rows
——- —— ——– ———- ———- ———- ———- ———-
Parse 4 0.00 0.00 0 0 0 0
Execute 4 0.00 0.00 0 0 0 0
Fetch 4 0.00 0.00 0 8 0 1
——- —— ——– ———- ———- ———- ———- ———-
total 12 0.00 0.00 0 8 0 1
Misses in library cache during parse: 1
Misses in library cache during execute: 1
Optimizer mode: ALL_ROWS
Parsing user id: 5
Number of plan statistics captured: 3
Rows (1st) Rows (avg) Rows (max) Row Source Operation
———- ———- ———- —————————————————
0 0 0 SORT ORDER BY (cr=2 pr=0 pw=0 time=104 us cost=3 size=1924 card=1)
0 0 0 NESTED LOOPS OUTER (cr=2 pr=0 pw=0 time=87 us cost=2 size=1924 card=1)
0 0 0 TABLE ACCESS FULL UT_TEARDOWNS (cr=2 pr=0 pw=0 time=85 us cost=2 size=1009 card=1)
0 0 0 TABLE ACCESS BY INDEX ROWID UT_LIB_TEARDOWNS (cr=0 pr=0 pw=0 time=0 us cost=0 size=915 card=1)
0 0 0 INDEX UNIQUE SCAN UT_LIB_TEARDOWNS_PK (cr=0 pr=0 pw=0 time=0 us cost=0 size=0 card=1)(object id 88645)
********************************************************************************
SQL ID: 13wqjcrf0g8qp Plan Hash: 1299690962
SELECT *
FROM
UT_TEST_ARGUMENTS where UT_ID = :ID order by POSITION
call count cpu elapsed disk query current rows
——- —— ——– ———- ———- ———- ———- ———-
Parse 4 0.00 0.00 0 0 0 0
Execute 4 0.00 0.00 0 0 0 0
Fetch 4 0.00 0.00 0 8 0 4
——- —— ——– ———- ———- ———- ———- ———-
total 12 0.00 0.00 0 8 0 4
Misses in library cache during parse: 1
Optimizer mode: ALL_ROWS
Parsing user id: 5
Number of plan statistics captured: 3
Rows (1st) Rows (avg) Rows (max) Row Source Operation
———- ———- ———- —————————————————
1 1 1 SORT ORDER BY (cr=2 pr=0 pw=0 time=92 us cost=3 size=185 card=1)
1 1 1 TABLE ACCESS FULL UT_TEST_ARGUMENTS (cr=2 pr=0 pw=0 time=63 us cost=2 size=185 card=1)
********************************************************************************
SELECT
TI.UTI_ID,
TI.UT_ID,
TI.NAME,
TI.EXPECTED_RETURN,
TI.EXPECTED_RETURN_ERROR,
TI.DYNAMIC_VALUE_QUERY,
DQ.LIB_DYN_QUERY_ID,
DQ.LIB_DYN_QUERY_NAME,
DQ.LIB_DYN_QUERY,
TI.CREATED_ON,
TI.CREATED_BY
FROM
UT_TEST_IMPL TI,
UT_LIB_DYN_QUERIES DQ
WHERE
TI.UT_ID = :ID and
TI.LIB_DYN_QUERY_ID = DQ.LIB_DYN_QUERY_ID(+)
call count cpu elapsed disk query current rows
——- —— ——– ———- ———- ———- ———- ———-
Parse 4 0.00 0.00 0 0 0 0
Execute 4 0.00 0.00 0 0 0 0
Fetch 4 0.00 0.00 0 12 0 13
——- —— ——– ———- ———- ———- ———- ———-
total 12 0.00 0.00 0 12 0 13
Misses in library cache during parse: 1
Misses in library cache during execute: 1
Optimizer mode: ALL_ROWS
Parsing user id: 5
Number of plan statistics captured: 3
Rows (1st) Rows (avg) Rows (max) Row Source Operation
———- ———- ———- —————————————————
3 3 3 NESTED LOOPS OUTER (cr=3 pr=0 pw=0 time=111 us cost=3 size=4224 card=3)
3 3 3 TABLE ACCESS FULL UT_TEST_IMPL (cr=3 pr=0 pw=0 time=78 us cost=2 size=915 card=3)
0 0 0 TABLE ACCESS BY INDEX ROWID UT_LIB_DYN_QUERIES (cr=0 pr=0 pw=0 time=11 us cost=1 size=1103 card=1)
0 0 0 INDEX UNIQUE SCAN UT_LIB_DYN_QUERIES_PK (cr=0 pr=0 pw=0 time=6 us cost=0 size=0 card=1)(object id 88655)
********************************************************************************
SELECT
L.VALIDATION_ID,
L.INDEX_NO,
L.VALIDATION,
LV.LIB_VALIDATION_ID,
LV.LIB_VALIDATION_NAME,
LV.LIB_VALIDATION,
L.APPLY_VALIDATION
FROM
UT_VALIDATIONS L,
UT_LIB_VALIDATIONS LV
WHERE
L.UTI_ID = :UTI_ID AND
L.LIB_VALIDATION_ID = LV.LIB_VALIDATION_ID(+)
ORDER BY
L.INDEX_NO
call count cpu elapsed disk query current rows
——- —— ——– ———- ———- ———- ———- ———-
Parse 13 0.00 0.00 0 0 0 0
Execute 13 0.00 0.00 0 0 0 0
Fetch 13 0.00 0.00 0 22 0 9
——- —— ——– ———- ———- ———- ———- ———-
total 39 0.00 0.00 0 22 0 9
Misses in library cache during parse: 1
Misses in library cache during execute: 1
Optimizer mode: ALL_ROWS
Parsing user id: 5
Number of plan statistics captured: 3
Rows (1st) Rows (avg) Rows (max) Row Source Operation
———- ———- ———- —————————————————
1 1 1 SORT ORDER BY (cr=2 pr=0 pw=0 time=79 us cost=3 size=3231 card=1)
1 1 1 NESTED LOOPS OUTER (cr=2 pr=0 pw=0 time=47 us cost=2 size=3231 card=1)
1 1 1 TABLE ACCESS BY INDEX ROWID UT_VALIDATIONS (cr=2 pr=0 pw=0 time=40 us cost=2 size=1078 card=1)
1 1 1 INDEX RANGE SCAN UT_VALIDATIONS_TEST_IMPL_IX (cr=1 pr=0 pw=0 time=23 us cost=1 size=0 card=1)(object id 88706)
0 0 0 TABLE ACCESS BY INDEX ROWID UT_LIB_VALIDATIONS (cr=0 pr=0 pw=0 time=3 us cost=0 size=2153 card=1)
0 0 0 INDEX UNIQUE SCAN UT_LIB_VALIDATIONS_PK (cr=0 pr=0 pw=0 time=2 us cost=0 size=0 card=1)(object id 88650)
********************************************************************************
SQL ID: 9kf349fr78kmu Plan Hash: 1199766055
SELECT *
FROM
UT_TEST_IMPL_ARGUMENTS where UTI_ID = :ID
call count cpu elapsed disk query current rows
——- —— ——– ———- ———- ———- ———- ———-
Parse 13 0.00 0.00 0 0 0 0
Execute 13 0.00 0.00 0 0 0 0
Fetch 13 0.00 0.00 0 26 0 13
——- —— ——– ———- ———- ———- ———- ———-
total 39 0.00 0.01 0 26 0 13
Misses in library cache during parse: 1
Optimizer mode: ALL_ROWS
Parsing user id: 5
Number of plan statistics captured: 3
Rows (1st) Rows (avg) Rows (max) Row Source Operation
———- ———- ———- —————————————————
1 1 1 TABLE ACCESS BY INDEX ROWID UT_TEST_IMPL_ARGUMENTS (cr=2 pr=0 pw=0 time=71 us cost=2 size=393 card=1)
1 1 1 INDEX RANGE SCAN UT_TEST_IMPL_ARGUMENTS_PK (cr=1 pr=0 pw=0 time=47 us cost=1 size=0 card=1)(object id 88702)
********************************************************************************
SQL ID: 3x12sr05w9h6t Plan Hash: 418339696
select id,name
from
ut_lookup_categories where (:NAME is null or name != :NAME)
call count cpu elapsed disk query current rows
——- —— ——– ———- ———- ———- ———- ———-
Parse 3 0.00 0.00 0 0 0 0
Execute 3 0.00 0.00 0 0 0 0
Fetch 3 0.00 0.00 0 6 0 9
——- —— ——– ———- ———- ———- ———- ———-
total 9 0.00 0.00 0 6 0 9
Misses in library cache during parse: 1
Misses in library cache during execute: 1
Optimizer mode: ALL_ROWS
Parsing user id: 5
Number of plan statistics captured: 3
Rows (1st) Rows (avg) Rows (max) Row Source Operation
———- ———- ———- —————————————————
3 3 3 TABLE ACCESS FULL UT_LOOKUP_CATEGORIES (cr=2 pr=0 pw=0 time=52 us cost=2 size=41 card=1)
********************************************************************************
SQL ID: f9vpdp25a0jq3 Plan Hash: 1604256170
select utr_id
from
ut_test_results where ut_id = :ID order by run_date desc
call count cpu elapsed disk query current rows
——- —— ——– ———- ———- ———- ———- ———-
Parse 3 0.00 0.00 0 0 0 0
Execute 3 0.00 0.00 0 0 0 0
Fetch 3 0.00 0.00 1 15 0 29
——- —— ——– ———- ———- ———- ———- ———-
total 9 0.00 0.00 1 15 0 29
Misses in library cache during parse: 1
Misses in library cache during execute: 1
Optimizer mode: ALL_ROWS
Parsing user id: 5
Number of plan statistics captured: 3
Rows (1st) Rows (avg) Rows (max) Row Source Operation
———- ———- ———- —————————————————
13 10 14 SORT ORDER BY (cr=5 pr=0 pw=0 time=239 us cost=4 size=1105 card=13)
13 10 14 TABLE ACCESS FULL UT_TEST_RESULTS (cr=5 pr=0 pw=0 time=52 us cost=3 size=1105 card=13)
********************************************************************************
SQL ID: 26u75yzykyuqd Plan Hash: 4033182254
select r.name,r.status,r.message,a.position,a.in_out
from
ut_test_impl_arg_results r, ut_test_arguments a where r.arg_id = a.arg_id
and r.utir_id = :UTIR_ID order by a.position asc, r.status asc
call count cpu elapsed disk query current rows
——- —— ——– ———- ———- ———- ———- ———-
Parse 118 0.00 0.00 0 0 0 0
Execute 118 0.00 0.00 0 0 0 0
Fetch 118 0.00 0.00 0 592 0 118
——- —— ——– ———- ———- ———- ———- ———-
total 354 0.00 0.01 0 592 0 118
Misses in library cache during parse: 1
Misses in library cache during execute: 1
Optimizer mode: ALL_ROWS
Parsing user id: 5
Number of plan statistics captured: 3
Rows (1st) Rows (avg) Rows (max) Row Source Operation
———- ———- ———- —————————————————
1 1 1 SORT ORDER BY (cr=5 pr=0 pw=0 time=107 us cost=4 size=154 card=1)
1 1 1 NESTED LOOPS (cr=5 pr=0 pw=0 time=86 us cost=3 size=154 card=1)
1 1 1 NESTED LOOPS (cr=4 pr=0 pw=0 time=70 us cost=3 size=154 card=1)
1 1 1 TABLE ACCESS BY INDEX ROWID UT_TEST_IMPL_ARG_RESULTS (cr=3 pr=0 pw=0 time=56 us cost=2 size=110 card=1)
1 1 1 INDEX RANGE SCAN UT_TEST_IMPL_ARG_RESULTS_IX3 (cr=2 pr=0 pw=0 time=42 us cost=1 size=0 card=1)(object id 88712)
1 1 1 INDEX UNIQUE SCAN UT_TEST_ARGUMENTS_PK (cr=1 pr=0 pw=0 time=12 us cost=0 size=0 card=1)(object id 88693)
1 1 1 TABLE ACCESS BY INDEX ROWID UT_TEST_ARGUMENTS (cr=1 pr=0 pw=0 time=5 us cost=1 size=44 card=1)
********************************************************************************
SQL ID: ar1d58uqggzja Plan Hash: 2923916072
select lib_validation_name,status,message,val_duration,index_no,val_type
from
ut_test_impl_val_results r, ut_validations v, ut_lib_validations lv where
r.utir_id = :UTIR_ID and v.validation_id=r.val_id and
lv.lib_validation_id(+)=v.lib_validation_id order by index_no asc
call count cpu elapsed disk query current rows
——- —— ——– ———- ———- ———- ———- ———-
Parse 118 0.00 0.00 0 0 0 0
Execute 118 0.00 0.00 0 0 0 0
Fetch 118 0.00 0.00 0 304 0 62
——- —— ——– ———- ———- ———- ———- ———-
total 354 0.00 0.01 0 304 0 62
Misses in library cache during parse: 1
Misses in library cache during execute: 1
Optimizer mode: ALL_ROWS
Parsing user id: 5
Number of plan statistics captured: 3
Rows (1st) Rows (avg) Rows (max) Row Source Operation
———- ———- ———- —————————————————
1 0 1 SORT ORDER BY (cr=2 pr=0 pw=0 time=66 us cost=4 size=237 card=1)
1 0 1 NESTED LOOPS OUTER (cr=2 pr=0 pw=0 time=51 us cost=3 size=237 card=1)
1 0 1 NESTED LOOPS (cr=2 pr=0 pw=0 time=48 us cost=3 size=181 card=1)
1 0 1 TABLE ACCESS BY INDEX ROWID UT_TEST_IMPL_VAL_RESULTS (cr=1 pr=0 pw=0 time=39 us cost=2 size=120 card=1)
1 0 1 INDEX RANGE SCAN UT_TEST_IMPL_VAL_RES_IX3 (cr=1 pr=0 pw=0 time=27 us cost=1 size=0 card=1)(object id 88720)
1 0 1 TABLE ACCESS BY INDEX ROWID UT_VALIDATIONS (cr=1 pr=0 pw=0 time=6 us cost=1 size=61 card=1)
1 0 1 INDEX UNIQUE SCAN UT_VALIDATIONS_PK (cr=0 pr=0 pw=0 time=4 us cost=0 size=0 card=1)(object id 88698)
0 0 0 TABLE ACCESS BY INDEX ROWID UT_LIB_VALIDATIONS (cr=0 pr=0 pw=0 time=1 us cost=0 size=56 card=1)
0 0 0 INDEX UNIQUE SCAN UT_LIB_VALIDATIONS_PK (cr=0 pr=0 pw=0 time=0 us cost=0 size=0 card=1)(object id 88650)
********************************************************************************
SQL ID: 47nz0wtfra549 Plan Hash: 4284258276
select name, status, message, run_date,coverage,test_user_name
from
ut_test_results where utr_id = :ID
call count cpu elapsed disk query current rows
——- —— ——– ———- ———- ———- ———- ———-
Parse 29 0.00 0.00 0 0 0 0
Execute 29 0.00 0.00 0 0 0 0
Fetch 29 0.00 0.00 0 58 0 29
——- —— ——– ———- ———- ———- ———- ———-
total 87 0.00 0.00 0 58 0 29
Misses in library cache during parse: 1
Misses in library cache during execute: 1
Optimizer mode: ALL_ROWS
Parsing user id: 5
Number of plan statistics captured: 3
Rows (1st) Rows (avg) Rows (max) Row Source Operation
———- ———- ———- —————————————————
1 1 1 TABLE ACCESS BY INDEX ROWID UT_TEST_RESULTS (cr=2 pr=0 pw=0 time=28 us cost=1 size=182 card=1)
1 1 1 INDEX UNIQUE SCAN UT_TEST_RESULTS_PK (cr=1 pr=0 pw=0 time=17 us cost=0 size=0 card=1)(object id 88670)
********************************************************************************
SQL ID: 95d8gn6wfg6tx Plan Hash: 1014508128
select utir_id,name,status,message,duration,startup_status, startup_message,
startup_duration, op_call_status, op_call_message, op_call_duration,
teardown_status, teardown_message, teardown_duration
from
ut_test_impl_results where utr_id = :UTR_ID order by run_date asc
call count cpu elapsed disk query current rows
——- —— ——– ———- ———- ———- ———- ———-
Parse 29 0.00 0.00 0 0 0 0
Execute 29 0.00 0.00 0 0 0 0
Fetch 29 0.00 0.00 0 90 0 118
——- —— ——– ———- ———- ———- ———- ———-
total 87 0.00 0.00 0 90 0 118
Misses in library cache during parse: 1
Misses in library cache during execute: 1
Optimizer mode: ALL_ROWS
Parsing user id: 5
Number of plan statistics captured: 3
Rows (1st) Rows (avg) Rows (max) Row Source Operation
———- ———- ———- —————————————————
4 4 4 SORT ORDER BY (cr=3 pr=0 pw=0 time=103 us cost=4 size=1940 card=4)
4 4 4 TABLE ACCESS BY INDEX ROWID UT_TEST_IMPL_RESULTS (cr=3 pr=0 pw=0 time=72 us cost=3 size=1940 card=4)
4 4 4 INDEX RANGE SCAN UT_TEST_IMPL_RESULTS_UT_T_IX2 (cr=2 pr=0 pw=0 time=45 us cost=1 size=0 card=4)(object id 88714)
********************************************************************************
SQL ID: c01s475sswtwj Plan Hash: 0
DECLARE handle_id number; BEGIN DBMS_LOCK.ALLOCATE_UNIQUE(:1 ,handle_id); :2
:= handle_id; END;
call count cpu elapsed disk query current rows
——- —— ——– ———- ———- ———- ———- ———-
Parse 5 0.00 0.00 0 0 0 0
Execute 5 0.00 0.00 0 0 0 5
Fetch 0 0.00 0.00 0 0 0 0
——- —— ——– ———- ———- ———- ———- ———-
total 10 0.00 0.00 0 0 0 5
Misses in library cache during parse: 0
Optimizer mode: ALL_ROWS
Parsing user id: 5
********************************************************************************
SQL ID: 1aqkx9sphqcqz Plan Hash: 1388734953
select DBMS_LOCK.REQUEST(:HANDLE,6,2)
from
dual
call count cpu elapsed disk query current rows
——- —— ——– ———- ———- ———- ———- ———-
Parse 3 0.00 0.00 0 0 0 0
Execute 3 0.00 0.00 0 0 0 0
Fetch 3 0.00 0.00 0 0 0 3
——- —— ——– ———- ———- ———- ———- ———-
total 9 0.00 0.00 0 0 0 3
Misses in library cache during parse: 1
Misses in library cache during execute: 1
Optimizer mode: ALL_ROWS
Parsing user id: 5
Number of plan statistics captured: 3
Rows (1st) Rows (avg) Rows (max) Row Source Operation
———- ———- ———- —————————————————
1 1 1 FAST DUAL (cr=0 pr=0 pw=0 time=2 us cost=2 size=0 card=1)
********************************************************************************
MERGE INTO UT_TEST_RESULTS dest
USING (SELECT
:UTR_ID utr_id,
:UT_ID ut_id,
:TEST_NAME name,
:STATUS status,
substrb(:MESSAGE, 1, 2000) message,
:COVERAGE coverage,
:TEST_USER_NAME test_user_name,
:CONNECTION_NAME connection_name
from dual) src
ON (dest.UTR_ID = src.UTR_ID)
WHEN MATCHED THEN
UPDATE SET
dest.STATUS = src.STATUS,
dest.MESSAGE = src.MESSAGE,
dest.COVERAGE = src.COVERAGE,
dest.TEST_USER_NAME = src.TEST_USER_NAME,
dest.CONNECTION_NAME = src.CONNECTION_NAME
WHEN NOT MATCHED THEN
INSERT (
UTR_ID,
UT_ID,
NAME,
STATUS,
MESSAGE,
COVERAGE,
TEST_USER_NAME,
CONNECTION_NAME,
RUN_DATE)
VALUES (
src.UTR_ID,
src.UT_ID,
src.NAME,
src.STATUS,
src.MESSAGE,
src.COVERAGE,
src.TEST_USER_NAME,
src.CONNECTION_NAME,
Current_Timestamp)
call count cpu elapsed disk query current rows
——- —— ——– ———- ———- ———- ———- ———-
Parse 2 0.00 0.00 0 0 0 0
Execute 2 0.00 0.01 0 8 12 2
Fetch 0 0.00 0.00 0 0 0 0
——- —— ——– ———- ———- ———- ———- ———-
total 4 0.00 0.01 0 8 12 2
Misses in library cache during parse: 2
Misses in library cache during execute: 2
Optimizer mode: ALL_ROWS
Parsing user id: 5
Number of plan statistics captured: 2
Rows (1st) Rows (avg) Rows (max) Row Source Operation
———- ———- ———- —————————————————
0 0 0 MERGE UT_TEST_RESULTS (cr=4 pr=0 pw=0 time=1690 us)
1 1 1 VIEW (cr=4 pr=0 pw=0 time=84 us)
1 1 1 NESTED LOOPS OUTER (cr=4 pr=0 pw=0 time=78 us cost=3 size=272 card=1)
1 1 1 TABLE ACCESS FULL DUAL (cr=2 pr=0 pw=0 time=56 us cost=2 size=2 card=1)
0 0 1 TABLE ACCESS BY INDEX ROWID UT_TEST_RESULTS (cr=2 pr=0 pw=0 time=16 us cost=1 size=270 card=1)
0 0 1 INDEX UNIQUE SCAN UT_TEST_RESULTS_PK (cr=1 pr=0 pw=0 time=12 us cost=0 size=0 card=1)(object id 88670)
********************************************************************************
SQL ID: c749bc43qqfz3 Plan Hash: 1388734953
SELECT SYSDATE
FROM
DUAL
call count cpu elapsed disk query current rows
——- —— ——– ———- ———- ———- ———- ———-
Parse 22 0.00 0.00 0 0 0 0
Execute 22 0.00 0.00 0 0 0 0
Fetch 22 0.00 0.00 0 0 0 22
——- —— ——– ———- ———- ———- ———- ———-
total 66 0.00 0.00 0 0 0 22
Misses in library cache during parse: 1
Optimizer mode: ALL_ROWS
Parsing user id: 5 (recursive depth: 1)
Number of plan statistics captured: 1
Rows (1st) Rows (avg) Rows (max) Row Source Operation
———- ———- ———- —————————————————
1 1 1 FAST DUAL (cr=0 pr=0 pw=0 time=1 us cost=2 size=0 card=1)
********************************************************************************
SQL ID: d6r1mk4p3j2uf Plan Hash: 1388734953
SELECT USER
FROM
DUAL
call count cpu elapsed disk query current rows
——- —— ——– ———- ———- ———- ———- ———-
Parse 22 0.00 0.00 0 0 0 0
Execute 22 0.00 0.00 0 0 0 0
Fetch 22 0.00 0.00 0 0 0 22
——- —— ——– ———- ———- ———- ———- ———-
total 66 0.00 0.00 0 0 0 22
Misses in library cache during parse: 1
Optimizer mode: ALL_ROWS
Parsing user id: 5 (recursive depth: 1)
Number of plan statistics captured: 1
Rows (1st) Rows (avg) Rows (max) Row Source Operation
———- ———- ———- —————————————————
1 1 1 FAST DUAL (cr=0 pr=0 pw=0 time=2 us cost=2 size=0 card=1)
********************************************************************************
MERGE INTO UT_TEST_IMPL_RESULTS dest
USING (SELECT
:UTIR_ID utir_id,
:UTI_ID uti_id,
:UTR_ID utr_id,
:IMPL_NAME name,
:STATUS status,
substrb(:MESSAGE, 1, 2000) message,
:START_TIME START_TIME,
:END_TIME END_TIME,
:DURATION DURATION,
:STARTUP_STATUS startup_status,
substrb(:STARTUP_MESSAGE, 1, 2000) startup_message,
:STARTUP_START_TIME startup_start_time,
:STARTUP_END_TIME startup_end_time,
:STARTUP_DURATION startup_duration,
:OP_CALL_STATUS op_call_status,
substrb(:OP_CALL_MESSAGE, 1, 2000) op_call_message,
:OP_CALL_START_TIME op_call_start_time,
:OP_CALL_END_TIME op_call_end_time,
:OP_CALL_DURATION op_call_duration,
:TEARDOWN_STATUS teardown_status,
substrb(:TEARDOWN_MESSAGE, 1, 2000) teardown_message,
:TEARDOWN_START_TIME teardown_start_time,
:TEARDOWN_END_TIME teardown_end_time,
:TEARDOWN_DURATION teardown_duration
from dual) src
ON (dest.UTIR_ID = src.UTIR_ID)
WHEN MATCHED THEN
UPDATE SET
dest.STATUS = src.STATUS,
dest.MESSAGE = src.MESSAGE,
dest.START_TIME = src.START_TIME,
dest.END_TIME = src.END_TIME,
dest.DURATION = src.DURATION,
dest.STARTUP_STATUS = src.STARTUP_STATUS,
dest.STARTUP_MESSAGE = src.STARTUP_MESSAGE,
dest.STARTUP_START_TIME = src.STARTUP_START_TIME,
dest.STARTUP_END_TIME = src.STARTUP_END_TIME,
dest.STARTUP_DURATION = src.STARTUP_DURATION,
dest.OP_CALL_STATUS = src.OP_CALL_STATUS,
dest.OP_CALL_MESSAGE = src.OP_CALL_MESSAGE,
dest.OP_CALL_START_TIME = src.OP_CALL_START_TIME,
dest.OP_CALL_END_TIME = src.OP_CALL_END_TIME,
dest.OP_CALL_DURATION = src.OP_CALL_DURATION,
dest.TEARDOWN_STATUS = src.TEARDOWN_STATUS,
dest.TEARDOWN_MESSAGE = src.TEARDOWN_MESSAGE,
dest.TEARDOWN_START_TIME = src.TEARDOWN_START_TIME,
dest.TEARDOWN_END_TIME = src.TEARDOWN_END_TIME,
dest.TEARDOWN_DURATION = src.TEARDOWN_DURATION
WHEN NOT MATCHED THEN
INSERT (
UTIR_ID,
UTI_ID,
UTR_ID,
NAME,
STATUS,
MESSAGE,
START_TIME,
END_TIME,
DURATION,
STARTUP_STATUS,
STARTUP_MESSAGE,
STARTUP_START_TIME,
STARTUP_END_TIME,
STARTUP_DURATION,
OP_CALL_STATUS,
OP_CALL_MESSAGE,
OP_CALL_START_TIME,
OP_CALL_END_TIME,
OP_CALL_DURATION,
TEARDOWN_STATUS,
TEARDOWN_MESSAGE,
TEARDOWN_START_TIME,
TEARDOWN_END_TIME,
TEARDOWN_DURATION)
VALUES (
src.UTIR_ID,
src.UTI_ID,
src.UTR_ID,
src.NAME,
src.STATUS,
src.MESSAGE,
src.START_TIME,
src.END_TIME,
src.DURATION,
src.STARTUP_STATUS,
src.STARTUP_MESSAGE,
src.STARTUP_START_TIME,
src.STARTUP_END_TIME,
src.STARTUP_DURATION,
src.OP_CALL_STATUS,
src.OP_CALL_MESSAGE,
src.OP_CALL_START_TIME,
src.OP_CALL_END_TIME,
src.OP_CALL_DURATION,
src.TEARDOWN_STATUS,
src.TEARDOWN_MESSAGE,
src.TEARDOWN_START_TIME,
src.TEARDOWN_END_TIME,
src.TEARDOWN_DURATION)
call count cpu elapsed disk query current rows
——- —— ——– ———- ———- ———- ———- ———-
Parse 8 0.00 0.00 0 0 0 0
Execute 8 0.02 0.02 0 40 60 8
Fetch 0 0.00 0.00 0 0 0 0
——- —— ——– ———- ———- ———- ———- ———-
total 16 0.03 0.03 0 40 60 8
Misses in library cache during parse: 2
Misses in library cache during execute: 3
Optimizer mode: ALL_ROWS
Parsing user id: 5
Number of plan statistics captured: 7
Rows (1st) Rows (avg) Rows (max) Row Source Operation
———- ———- ———- —————————————————
0 0 0 MERGE UT_TEST_IMPL_RESULTS (cr=5 pr=0 pw=0 time=1059 us)
1 1 1 VIEW (cr=4 pr=0 pw=0 time=89 us)
1 1 1 NESTED LOOPS OUTER (cr=4 pr=0 pw=0 time=80 us cost=3 size=487 card=1)
1 1 1 TABLE ACCESS FULL DUAL (cr=2 pr=0 pw=0 time=47 us cost=2 size=2 card=1)
0 0 1 TABLE ACCESS BY INDEX ROWID UT_TEST_IMPL_RESULTS (cr=2 pr=0 pw=0 time=27 us cost=1 size=485 card=1)
0 0 1 INDEX UNIQUE SCAN UT_TEST_IMPL_RESULTS_PK (cr=2 pr=0 pw=0 time=21 us cost=0 size=0 card=1)(object id 88694)
********************************************************************************
SQL ID: 7upqnutt3cbr9 Plan Hash: 1388734953
SELECT CURRENT_TIMESTAMP
FROM
DUAL
call count cpu elapsed disk query current rows
——- —— ——– ———- ———- ———- ———- ———-
Parse 1 0.00 0.00 0 0 0 0
Execute 4 0.00 0.00 0 0 0 0
Fetch 4 0.00 0.00 0 0 0 4
——- —— ——– ———- ———- ———- ———- ———-
total 9 0.00 0.00 0 0 0 4
Misses in library cache during parse: 1
Optimizer mode: ALL_ROWS
Parsing user id: 5 (recursive depth: 1)
Number of plan statistics captured: 1
Rows (1st) Rows (avg) Rows (max) Row Source Operation
———- ———- ———- —————————————————
1 1 1 FAST DUAL (cr=0 pr=0 pw=0 time=3 us cost=2 size=0 card=1)
********************************************************************************
MERGE INTO UT_TEST_IMPL_ARG_RESULTS dest
USING (SELECT :UTIAR_ID utiar_id, :UTIR_ID utir_id, :UTI_ID uti_id, :ARG_NAME name,:ARG_ID arg_id, :STATUS status, substrb(:MESSAGE, 1, 2000) message from dual) src
ON (dest.UTIAR_ID = src.UTIAR_ID)
WHEN MATCHED THEN
UPDATE SET
dest.STATUS = src.STATUS,
dest.MESSAGE = src.MESSAGE
WHEN NOT MATCHED THEN
INSERT (UTIAR_ID, UTIR_ID, UTI_ID, ARG_ID, NAME, STATUS, MESSAGE, RUN_DATE)
VALUES (src.UTIAR_ID, src.UTIR_ID, src.UTI_ID, src.ARG_ID, src.NAME, src.STATUS, src.MESSAGE, Current_Timestamp)
call count cpu elapsed disk query current rows
——- —— ——– ———- ———- ———- ———- ———-
Parse 4 0.00 0.00 0 0 0 0
Execute 4 0.00 0.02 1 20 52 4
Fetch 0 0.00 0.00 0 0 0 0
——- —— ——– ———- ———- ———- ———- ———-
total 8 0.00 0.02 1 20 52 4
Misses in library cache during parse: 1
Misses in library cache during execute: 1
Optimizer mode: ALL_ROWS
Parsing user id: 5
Number of plan statistics captured: 3
Rows (1st) Rows (avg) Rows (max) Row Source Operation
———- ———- ———- —————————————————
0 0 0 MERGE UT_TEST_IMPL_ARG_RESULTS (cr=5 pr=0 pw=0 time=6479 us)
1 1 1 VIEW (cr=4 pr=0 pw=0 time=121 us)
1 1 1 NESTED LOOPS OUTER (cr=4 pr=0 pw=0 time=113 us cost=3 size=230 card=1)
1 1 1 TABLE ACCESS FULL DUAL (cr=2 pr=0 pw=0 time=39 us cost=2 size=2 card=1)
0 0 0 TABLE ACCESS BY INDEX ROWID UT_TEST_IMPL_ARG_RESULTS (cr=2 pr=0 pw=0 time=68 us cost=1 size=228 card=1)
0 0 0 INDEX UNIQUE SCAN UT_TEST_IMPL_ARG_RESULTS_PK (cr=2 pr=0 pw=0 time=66 us cost=0 size=0 card=1)(object id 88701)
********************************************************************************
MERGE INTO UT_TEST_IMPL_VAL_RESULTS dest
USING (SELECT
:UTIVR_ID utivr_id,
:UTIR_ID utir_id,
:UTI_ID uti_id,
:VAL_ID val_id,
:VAL_TYPE val_type,
:STATUS status,
substrb(:MESSAGE, 1, 2000) message,
:VAL_START_TIME val_start_time,
:VAL_END_TIME val_end_time,
:VAL_DURATION val_duration
from dual) src
ON (dest.UTIVR_ID = src.UTIVR_ID)
WHEN MATCHED THEN
UPDATE SET
dest.STATUS = src.STATUS,
dest.MESSAGE = src.MESSAGE,
dest.VAL_START_TIME = src.VAL_START_TIME,
dest.VAL_END_TIME = src.VAL_END_TIME,
dest.VAL_DURATION = src.VAL_DURATION
WHEN NOT MATCHED THEN
INSERT (
UTIVR_ID,
UTIR_ID,
UTI_ID,
VAL_ID,
VAL_TYPE,
STATUS,
MESSAGE,
VAL_START_TIME,
VAL_END_TIME,
VAL_DURATION,
RUN_DATE)
VALUES (
src.UTIVR_ID,
src.UTIR_ID,
src.UTI_ID,
src.VAL_ID,
src.VAL_TYPE,
src.STATUS,
src.MESSAGE,
src.VAL_START_TIME,
src.VAL_END_TIME,
src.VAL_DURATION,
sysdate)
call count cpu elapsed disk query current rows
——- —— ——– ———- ———- ———- ———- ———-
Parse 4 0.00 0.00 0 0 0 0
Execute 4 0.01 0.01 0 16 38 4
Fetch 0 0.00 0.00 0 0 0 0
——- —— ——– ———- ———- ———- ———- ———-
total 8 0.01 0.01 0 16 38 4
Misses in library cache during parse: 2
Misses in library cache during execute: 3
Optimizer mode: ALL_ROWS
Parsing user id: 5
Number of plan statistics captured: 4
Rows (1st) Rows (avg) Rows (max) Row Source Operation
———- ———- ———- —————————————————
0 0 0 MERGE UT_TEST_IMPL_VAL_RESULTS (cr=4 pr=0 pw=0 time=858 us)
1 1 1 VIEW (cr=4 pr=0 pw=0 time=115 us)
1 1 1 NESTED LOOPS OUTER (cr=4 pr=0 pw=0 time=110 us cost=3 size=262 card=1)
1 1 1 TABLE ACCESS FULL DUAL (cr=2 pr=0 pw=0 time=62 us cost=2 size=2 card=1)
0 0 1 TABLE ACCESS BY INDEX ROWID UT_TEST_IMPL_VAL_RESULTS (cr=2 pr=0 pw=0 time=45 us cost=1 size=260 card=1)
0 0 1 INDEX UNIQUE SCAN UT_TEST_IMPL_VAL_RES_PK (cr=1 pr=0 pw=0 time=40 us cost=0 size=0 card=1)(object id 88665)
********************************************************************************
SQL ID: 5s3qckpf9urtc Plan Hash: 1388734953
select DBMS_LOCK.RELEASE(:HANDLE)
from
dual
call count cpu elapsed disk query current rows
——- —— ——– ———- ———- ———- ———- ———-
Parse 2 0.00 0.00 0 0 0 0
Execute 2 0.00 0.00 0 0 0 0
Fetch 2 0.00 0.00 0 0 0 2
——- —— ——– ———- ———- ———- ———- ———-
total 6 0.00 0.00 0 0 0 2
Misses in library cache during parse: 1
Misses in library cache during execute: 1
Optimizer mode: ALL_ROWS
Parsing user id: 5
Number of plan statistics captured: 2
Rows (1st) Rows (avg) Rows (max) Row Source Operation
———- ———- ———- —————————————————
1 1 1 FAST DUAL (cr=0 pr=0 pw=0 time=2 us cost=2 size=0 card=1)
********************************************************************************
OVERALL TOTALS FOR ALL NON-RECURSIVE STATEMENTS
call count cpu elapsed disk query current rows
——- —— ——– ———- ———- ———- ———- ———-
Parse 379 0.02 0.04 0 5 0 0
Execute 379 0.12 0.15 1 87 162 23
Fetch 356 0.01 0.02 1 1164 0 433
——- —— ——– ———- ———- ———- ———- ———-
total 1114 0.15 0.22 2 1256 162 456
Misses in library cache during parse: 25
Misses in library cache during execute: 24
OVERALL TOTALS FOR ALL RECURSIVE STATEMENTS
call count cpu elapsed disk query current rows
——- —— ——– ———- ———- ———- ———- ———-
Parse 76 0.00 0.01 0 0 0 0
Execute 264 0.01 0.01 0 15 25 5
Fetch 449 0.01 0.00 0 706 0 400
——- —— ——– ———- ———- ———- ———- ———-
total 789 0.03 0.03 0 721 25 405
Misses in library cache during parse: 8
Misses in library cache during execute: 5
69 user SQL statements in session.
27 internal SQL statements in session.
96 SQL statements in session.
0 statements EXPLAINed in this session.
********************************************************************************
Trace file: UTDB_ora_7487.trc
Trace file compatibility: 11.1.0.7
Sort options: default
1 session in tracefile.
69 user SQL statements in trace file.
27 internal SQL statements in trace file.
96 SQL statements in trace file.
51 unique SQL statements in trace file.
4853 lines in trace file.
224 elapsed seconds in trace file.
Okay, I will try to get it from DBA, once I get it, will post here. Thanks for the quick replies.
Regards,
Ayan.
Sorry, I can’t get it, my company policy won’t allow to send any such files. But I can give you a glimps of the tables. I am dealing with two tables called employees and departments. Employee has 17 rows in total and department 5 rows. I have two procedure emp_dept_change and salary_bonus.
emp_dept_change will take employee_id as parameter and change the deparment of the employee.
salary_bonus will take employee_id and depending upon department_id bonus will be awarded.
My test cases are build around this two procedures. This is it, please let me know if you need any more info.
I don’t want a trace of your code – I want a trace of OUR code – running to get the unit test when you try to open it. Then I can see why it’s so slow.
Hi Jeff,
Below is my system config.
OS- Windows 64 bit, CPU- Intel i5 3.4 GHz, 8.00 GB RAM.
SQL developer version 4.0.2.15. I have followed the tricks you have stated as above and it became fast. But still it is dead slow when it comes in Unit Test module. It is very slow in Loading a test/ Run a test with single implementation/ Saving a test/ Run a suit which has 7 test implementations in total( only single implementation with two values through dynamic query) is taking atleast 5 minute in avarage.
Please help me here.
Regards,
Ayan.
How slow is slow?
Click on a test, let it get loaded and you can get a cup of coffee from near by break out area. It is that slow.
Yeah, that’s not good.
Can you trace the Unit Test repository session and send me the file? I reckon the problem is with a query and not the UI.
Can you please tell me how to get the log? I am not aware of it.
Oracle Session Trace – collects everything that happens in your session, queries ran, time executed, waits, etc…
It’ll write a file on the server, so if you don’t have access, you’ll need to get your DBA to get you the file.
OK thanks for that feedback. I’ve also got a few versions locally installed. I am running on Windows 7 64-bit so do I need to use a 64-bit JDK? The only one of this I have is 1.6.0_31.
I am running version 3.2.20.09 and according to the release notes – http://www.oracle.com/technetwork/developer-tools/sql-developer/sqldev-32-relnotes-1734493.html – supports a minimum java version of 1.6.0_04 to a maximum java version less than 1.7.
So this should be ok right? Last thing is how do I change the JDK path? Is it simply updating this file – sqldeveloper.conf?
You don’t have to run a 64 bit JDK if you don’t want to. But if you’re on Windows 32 bit OS, then you HAVE to use a 32 bit JDK – does that make sense?
In version 3.2 and lower, the JDK is specified in the sqldeveloper.conf file in the bin directory of where you extracted the SQL Developer zip file.
If I am using SQL Developer on a network does the performance of SQL Developer get affected if the Java is on a network share which possibly could have a slower connection rather than a local installation? I’ve got terrible load times and have already disabled extensions so looking for the next thing to try – thought this might be a factor.
Sorry, are you saying your JDK isn’t actually on the same machine as where you are running SQL Developer? Yeah, that would be bad. Sorry, if I’m not understanding you correctly.
Hi Jeff,
Your post is really helpful. I disabled the extensions and it improved the performance of query execution. However, I still see slow performance while opening the tables. It takes much time to load the tables. Can anything be done to improve this ?
Are you connected to a remote database? Network latency is the biggest ‘suck.’
I’ve noticed general and overall performance improvement in version 4 – I’d try upgrading first and see if that makes a difference.
Yes. We are connected to a remote database. I tried using version 4 but it did not made any difference. Honestly speaking, I found 3.1 with a better speed on executing queries. Only the issue which remains is loading the tables. Can you suggest some solution to it ?
I would run SQL Developer in ‘debug’ mode. Go to the sqldeveloper.conf file and change the last line from nondebug.conf to debug.conf
Start up SQL Developer, load your tables.
Do this for version 3 and version 4.
Now compare the logs that are generated in the panels and see where the biggest time suck is. Report back.
Maybe you should add something along the lines of “disabling the extensions in 3.2 might break other functions” in big red font? 🙂 I spent a few months being unable to do a database diff (while we were in the heavy migration phase, no less) after disabling versioning support extension. Found it accidentally after discovering that “import from XLS” isn’t working as well because it depends on some other extension.
P.S. The topic about it at oracle SQLDev forums got wiped&locked (I wonder why), so folks encountering the same problem will not be able to find the solution. Your blog would be a good place to address those issues, really.
Probably not a bad idea…although it is a BUG that I wasn’t aware of until I actually wrote this post and had people report it back. Most of those issues have been fixed in v4. Not sure why’d you’d wait several months to ask for help though?
The OTN threads generally only get locked when someone gets abusive, although I’ve noticed a few ‘power users’ like to get heavy handed with the thread locking too. Do you have the forum thread ID handy?
Yep, the thread is here – https://forums.oracle.com/thread/2480742. I am not the creator, but since my problem was the same I went ahead and posted the exception stacktrace that was written to console upon calling diff (you replied there as well, if you remember).
See, I didn’t wait to ask for help, I just didn’t get any until I went ahead to test everything I could and found the solution myself 🙂 I was about to mail you already, asking for help, though.
Hi,
interesting post! I just wanted to try to disable those extensions in SQL Developer Version 4.0.0.12 – but where did that tab go? There is “Debugger” and “External Editor” but no “Extensions” in between 🙁
Funny thing: When I clicked into the help menu to find out and copy my version number I also found an extension tab that gives me lot of information about loading and initialization time (~7s in total). But unfortunately there’s no way to disable anything.
So how is that done in 4.0?
Cheers,
Marcus
It’s not plugged in yet, but when it is, you’ll find it in Tools > Features.
Thanks for the tips! I’ve followed your advice, but I’m still loading SQL Developer in 2-3 minutes (down from 15-20 minutes).
I’ve noticed this only seems to happen on the first load – when I reopen SQL Developer later on (say I run a few queries, close the software, then open it again to do something else), it loads much faster.
Any thoughts about what could be happening here?
What are your machine specs? OS, Memory, CPU load, etc?
Windows 7 64 bit OS, 4GB RAM, very low CPU load at any given time…
SQL Developer – no automatic updates, no plugins, set to OS UI settings.
Thanks for these tips!
It would be helpful to mention that the “SQL History Limit” setting is under Tools, Preferences, then: Database, Worksheet, SQL History Limit.
I take it you had a hard time finding this preference?
Right!
BTW: I have found over the weekend that many feature that I was interested in are extensions dependent (e.g. DBA Sections, Table Data Import/Export etc). IMHO: It may not be a good idea to switch off extensions.
I wonder if you have a good list of extensions along with a short description that would be kind of “core” part of SQL Developer? I would immagine at least extensions written by Oracle folks would be part of the list
A matrix would be helpful I think…on the topic I generally advise folks to at least disable the Migrations and TimesTen extensions. And remember, that’s only IF you notice SQL Developer taking too long to start up.
Just for your records. SQL Dev 3.2 start time w/ extensions on my laptop (8GB + SSD HDD) 13 secs. No extensions 8 secs.
You went from not so bad, to pretty fast. Some users will say it takes upwards of a minute to start and by disabling migrations and modeling extensions they can get down to 20 seconds or so…btw, in next version we are completely changing up how java classes are loaded up and such, with hopefully end result of an even meaner and leaner (faster) SQL Developer.
I just read your nice blog and tested to supress some sql developer extensions in sql dev 3.1. It really opens faster but unfortunately there are some curious dependencies. If you uncheck “data miner” your are no more able to open existing “data models” and if you uncheck “scheduler” cut and paste of a table into the sql workspace does not work any longer. It looks like some more work to do 😉
Roland
I tested the Modeler with disabled Data Miner extension and it worked just fine for me.
Here’s what I tried:
What are you seeing?
Also, what do you means ‘cut and paste of a table’?
hi Jeff,
I run my tests again, here my results (unchecking data miner was not the reason, sorry):
1) data model does not open after disabling an extension
Preferences–Extensions–Unchecked ‘version support’, restart SD and try to open an existing data model produces an error: “SEVERE 33 0 oracle.ide.IdeCore Exception firing mainWindowOpened to oracle.dbtools.crest.fcp.DataModelerAddin$1@1d0462”
–> enable version support again and the data model opens again
2) drag & drop does not work after disabling “SQL dev scheduler” extension
when you drag and drop a table from the directory navigation tree into a sql worksheet you get normally a pre generated SQL “… select a,b from table” pasted into the sql worksheet. But when you have the scheduler-extension disabled this does not work any more.
–> enable “scheduler ext.” and its works again
I checked and unchecked each extension one by one to avoid side effects, quite boring because it takes about 4 min to open a data model with 10 small tables each time 😉
Roland
Your previous comment stated you disabled DataMiner, not Version Support. Version support is tightly integrated with the modeler, so I”m not surprised there’s a conflict there.
Firing up the VM now to check out your scheduler issue.
I just tested your 2nd scenario, and it’s actually working for me.
Here’s what I have:
SQL Developer 3.1.07
JDK 1.7.0_05
Oracle 11.2.0.3
Windows 7 64 Bit
I disabled ONLY the ‘Oracle SQL Developer – Scheduler’ extension. Re-started SQL Developer. Connected to my db. Dragged 2 tables into the worksheet. Got the pop-up dialog asking me what I wanted. I selected the ‘Join’, and it splat the expected SQL to my worksheet.
What does your scenario look like exactly?
I made all tests again and I think I found the dependencies:
The code for d&d functionality must rely on the “scheduler” or “migration core” extension.
here how I tested:
1. all ext. checked = ok
2. all ext. unchecked = not ok
3. check at least “scheduler” or “migration core” = ok
Roland
my environment:
SQL Developer 3.1.07
JDK 1.7.0_05
Oracle 11.2.0.2.0
Windows Vista 32 Bit