Yeah, we support RAC. Note, we did fix quite a few RAC related bugs in the 4.1.1 update. These screenshots were taken with version 4.1.2.
When you want to look at historical data in ASH or AWR, you’ll have to specify the Instance number to pull the report from.
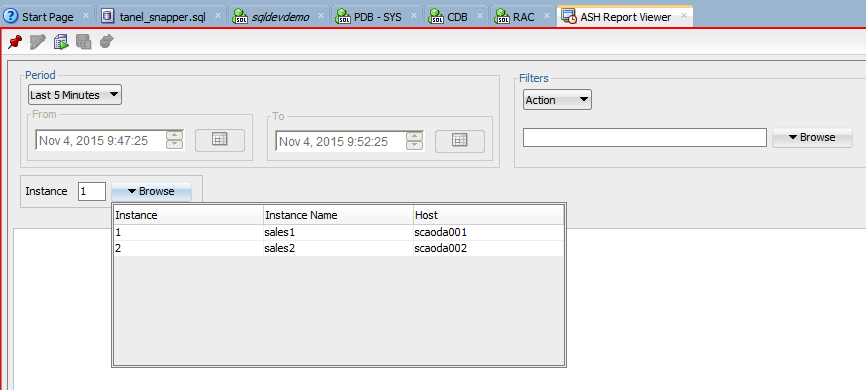
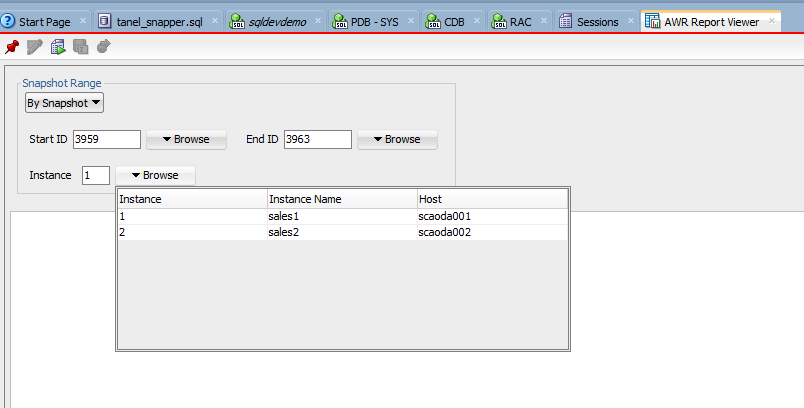
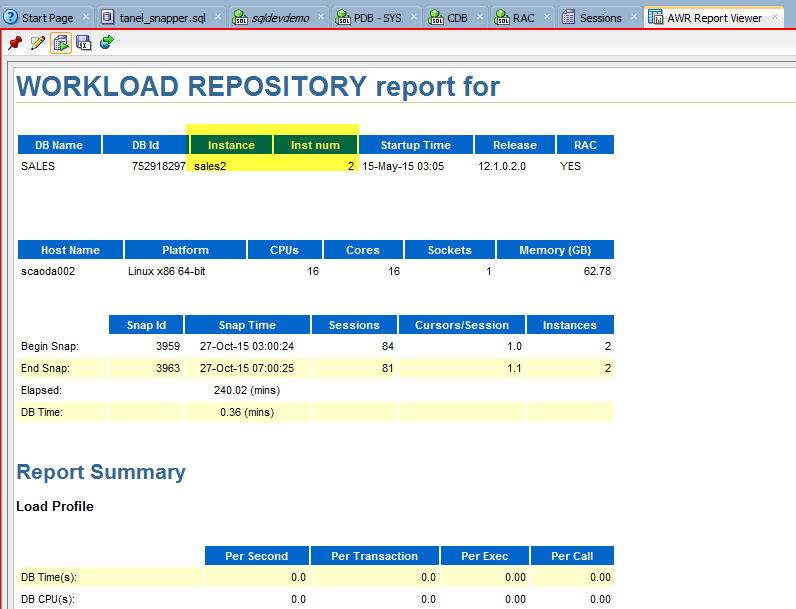
And the report…
Or if you want to browse sessions…
You can of course filter on any column in the Monitor Sessions page. To see only activity on a specific node, use the INST_ID column.
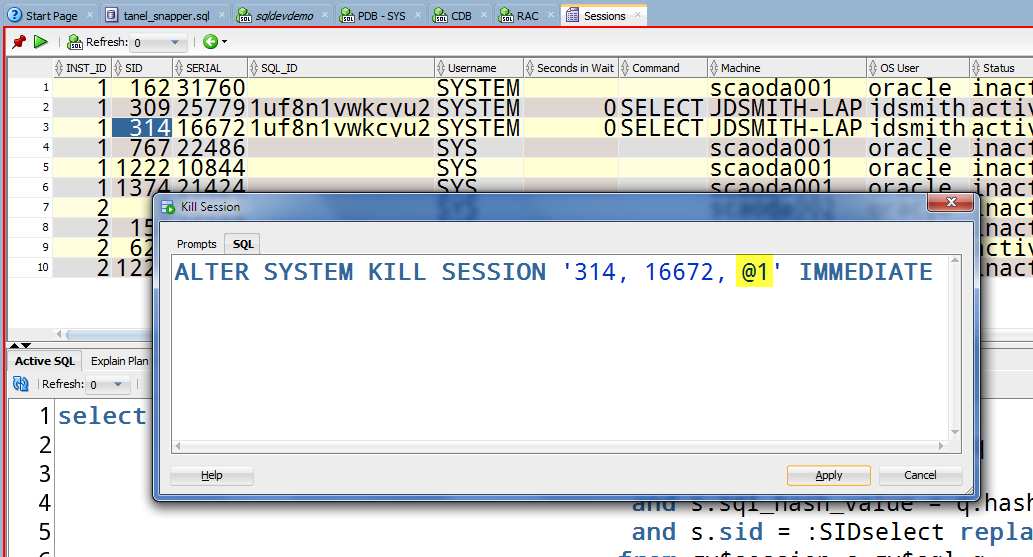
If you want to kill or trace a session, we’ll include the INST_ID info so the cluster knows which node to kill or trace the session on.
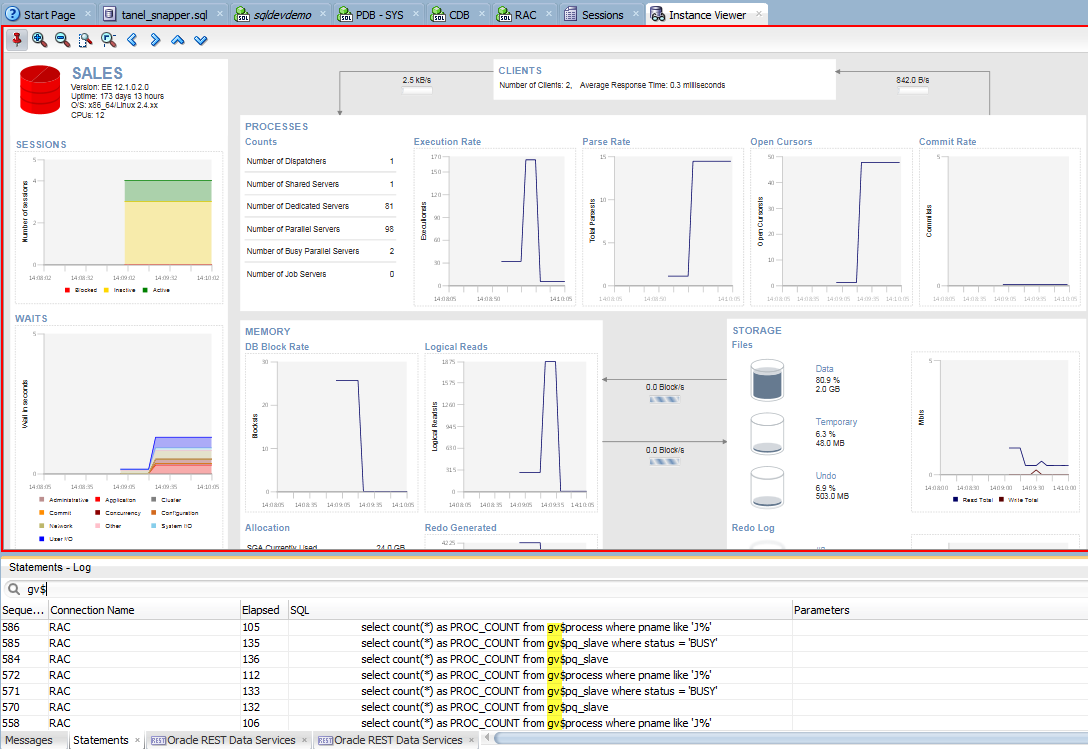
Behind the scenes we’re looking at GV$ views whenever possible. You can see this for yourself if you go to customize a report or use the View > Log > Statements panel.
About the debugger…
SQL Developer can debug PL/SQL on a RAC system as well. But, your connection needs to be on the RAC Node Instance – don’t let the cluster pick a node for you. This way the debugger can find it’s way back.


2 Comments
Howdy Jeff!
Wondering if this behaviour has changed in recent versions? When I pull up the instance viewer and check the statements they’re all running against V$ not GV$ … is there a setting somewhere in recent releases that controls this?
Currently using 23.1.1.345
Cheers,
it’s showing you the load on the individual rac node…are you asking if we’re planning on building that so you can tool around to the separate instances or give an overview of the entire clustser? Answer: probably not.