Version 24.3 of our Oracle extension for VS Code is now available in the marketplace!

As the title demonstrates, the showcase feature for 24.3 is support for debugging your PL/SQL programs!
However, that’s not all, here’s a look at what else is available (full changelog!)
New Features
- Code Formatting Preferences
- Format selected text (vs all)
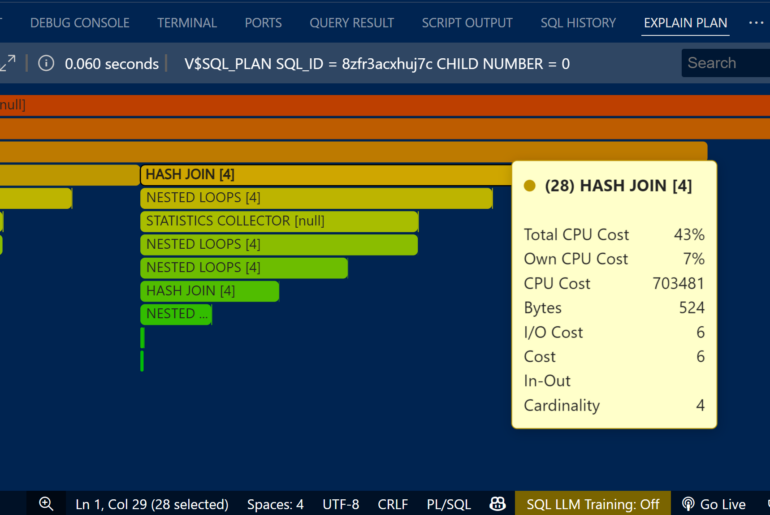
- Advanced Explain Plans
- Task Monitor
- Additional JSON Relational Duality View & Builder features
Bug Fixes
- allow more than 1 pl/sql object to be opened
- TNSNames files with DESCRIPTION_LISTS now working
- Copy to Clipboard from grid will not quote strings
- Functions not treated as procedures by runner when return %rowtype
- columns shown in wrong order when browsing tables
Introducing the PL/SQL Debugger
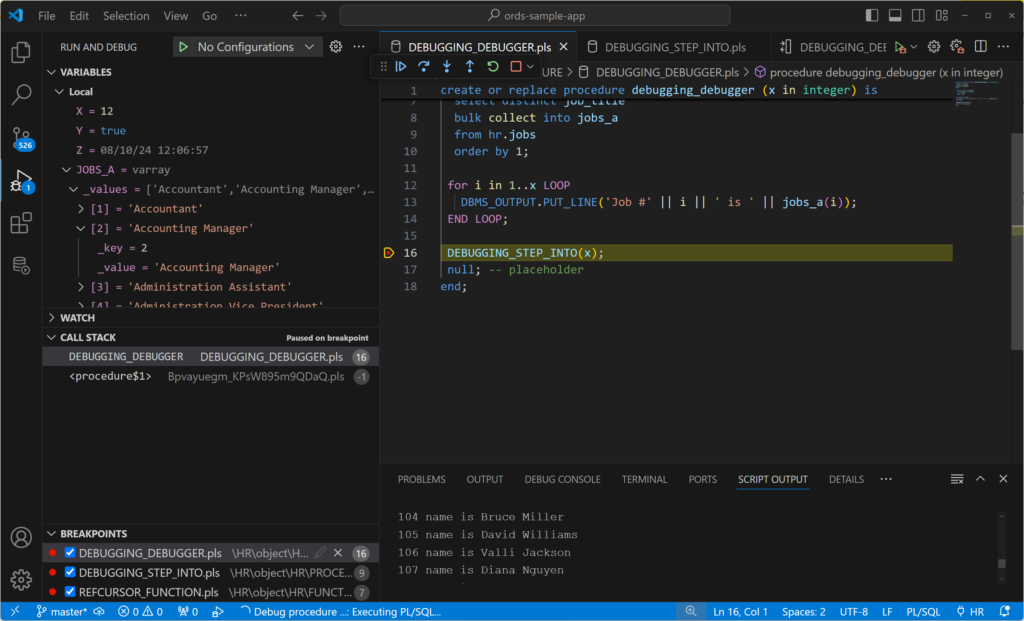
This is the first release of our VS Code extension featuring the ability to open a PL/SQL program, set a breakpoint, and execute the code, step over your code, observe the values of your variables, step into other programs, observe the call stack, and see your output.
Prerequisites
- exec privs on the program to be debugged
- DEBUG CONNECT SESSION priv is granted
- a network path from the database to your VS Code client
That’s right, we’re using the Java Debug Wire Protocol (JDWP), and there are many posts out there that discuss how to manage your database’s Access Control Lists (ACL) for allowing debug connection requests to be made.
Advice for sorting ACLs for PL/SQL debugging
- Colm’s blog (fun fact, Colm is the architect for this VS Code extension)
- Galo’s blog
Let’s debug some code, the Movie!
Let’s debug some code, and I like to read vs watch TV
First some simple code. I’m going to assume you have access to or can fake your way through the HR schema. Then I have a TYPE and two procedures, one which calls the other.
Our TYPE is an array, and our procedures bulk collect into the array, run some loops, put some data into a cursor, and then finally our old friend DBMS_OUTPUT pops up a few times.
The Code
create or replace type array_jobs is varray(150) of varchar2(100);
/

create or replace procedure debugging_step_into (how_many in integer) IS
 cursor demo_debug is select * from employees fetch first how_many rows only;
 fullname varchar2(100);
BEGIN
    for counter in demo_debug LOOP
     fullname := counter.first_name || ' ' || counter.last_name;
     dbms_output.put_line(counter.employee_id || ' name is ' || fullname);
     fullname := '';
    end loop;
END debugging_step_into;
/

create or replace procedure debugging_debugger (x in integer) is
 y boolean := true;
 z date := sysdate;
 jobs_a array_jobs;
begin

  select distinct job_title
  bulk collect into jobs_a
  from hr.jobs
  order by 1;

 for i in 1..x LOOP
   DBMS_OUTPUT.PUT_LINE('Job #' || i || ' is ' || jobs_a(i));
 END LOOP;

 DEBUGGING_STEP_INTO(x);
 null; -- placeholder
end;
/
Yes, my code is simple, but I’m here to show you the debugger, not how awesome I am not at PL/SQL.
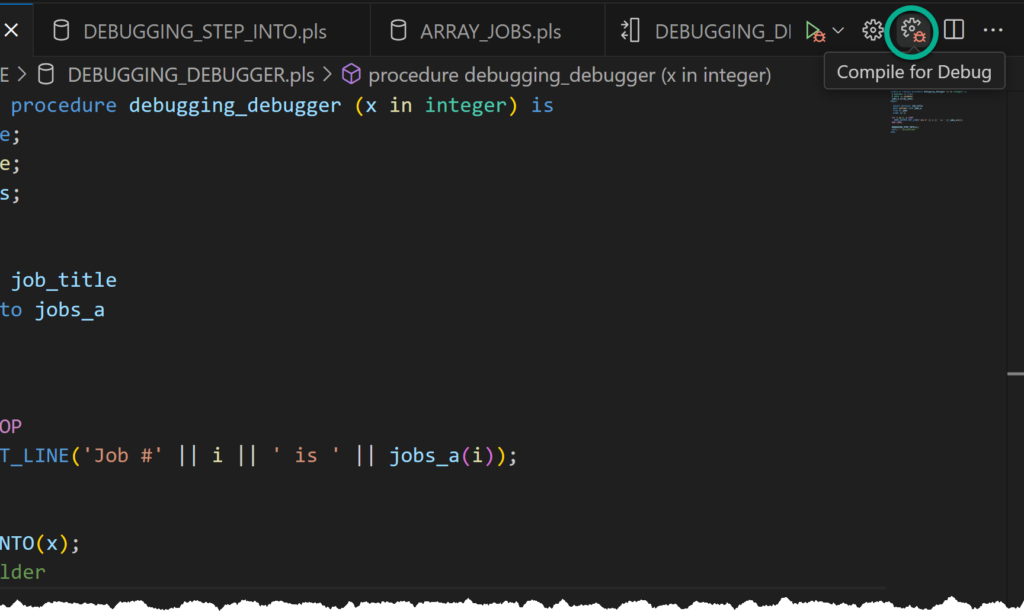
As you’re compiling these 3 PL/SQL units, take care to COMPILE FOR DEBUG.
Starting the debugger
Open your file or the pl/sql program directly from the database, specifically, DEBUGGING_DEBUGGER. Click on the program in the tree (or double-click if you disabled the open on single click preference in VS Code).
Optional but recommended: set a breakpoint
Find an executable line of code, and activate the breakpoint by hovering in the left gutter, then clicking to activate. You’ll see a red dot show up.
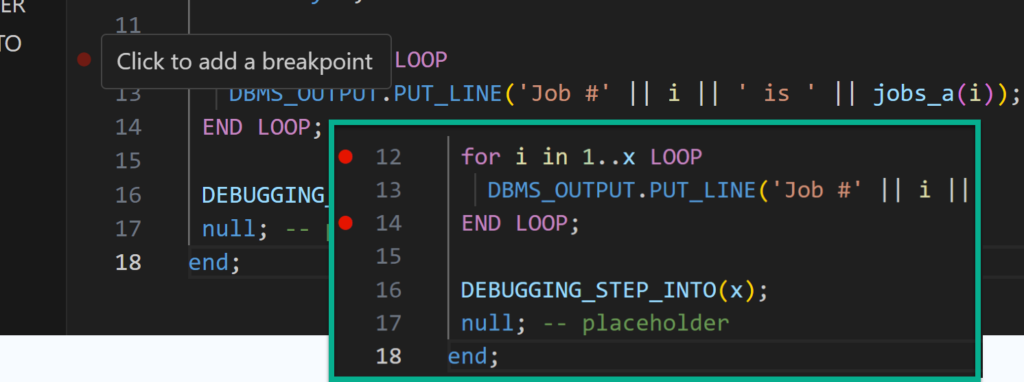
If you don’t set a breakpoint, the default behavior will be to execute the program till it hits a breakpoint and without any breakpoints, you’ll just see it run to completion. Boo, so set a breakpoint.
Instead of just executing the program, we’re going to DEBUG it. Observe the new dropdown option for the execute button:
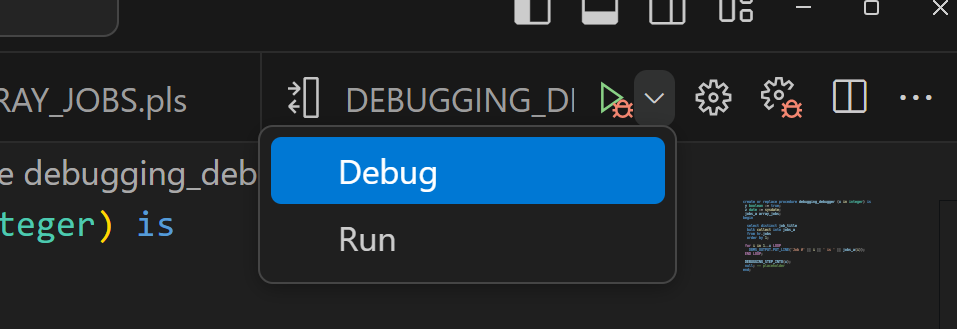
What pops up is our ‘runner’ code block. This is the anonymous PL/SQL we’ll execute which will cause the pl/sql program in question to be executed.
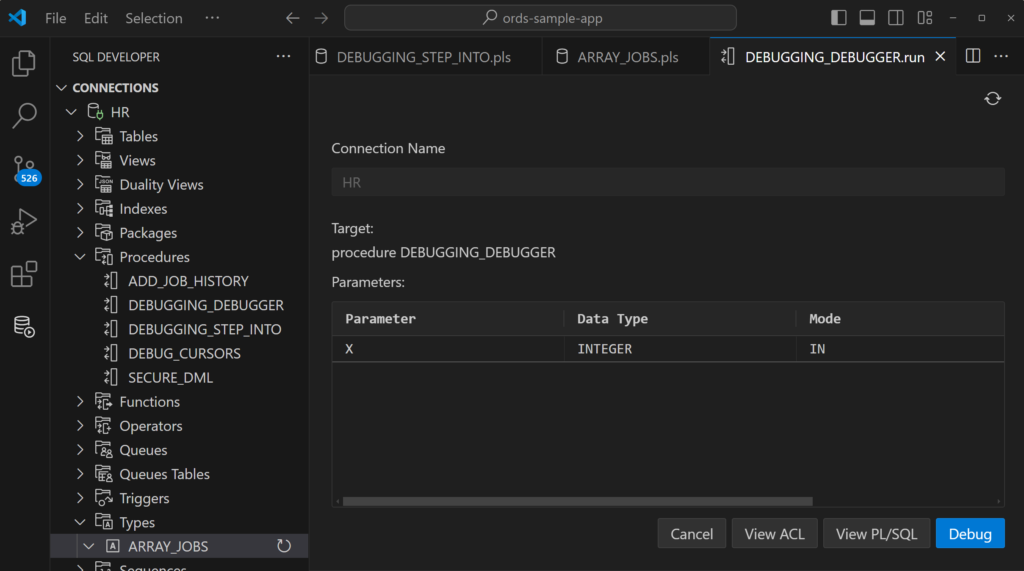
Procedure DEBUGGING_DEBUGGER only has a single input, ‘X,’ and it needs an integer value. Something between 1 and 19 should be OK.
VIEW ACL
We’re going to try to help you with your access control list configuration in your database. If you click the View ACL button, you’ll see this –
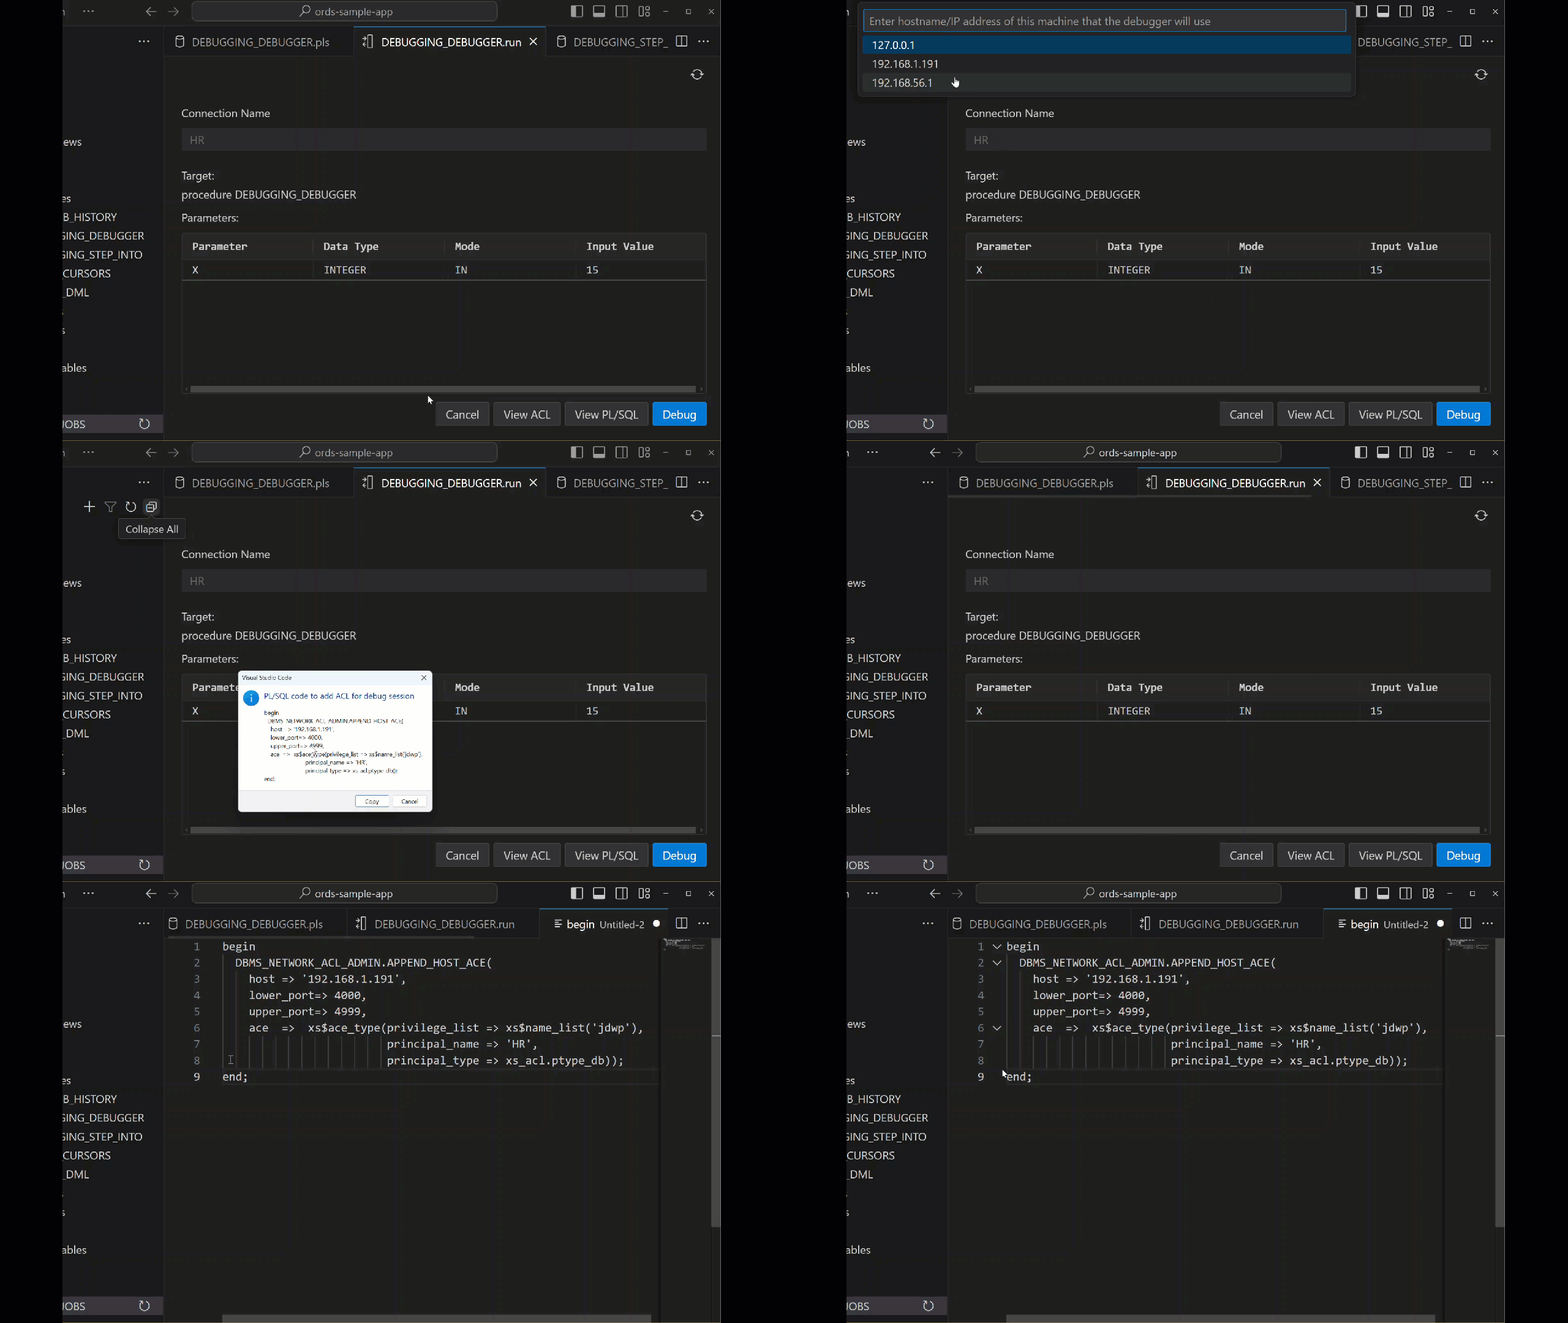
The dialog prints a notification you can use to copy some code to the clipboard. That code is hopefully smart enough to get your ACL defined.
- we’re getting a list of your machine’s IP addresses
- you’re picking one of those
- we generate the ANON pl/sql block to open that IP for JDWP
If you run that, you’re telling the database it’s OK to make an outbound network request to that specified IP address on the specified port ranges, for debugging. You’re free to tweak that as you see fit. The DBMS_NETWORK_ACL_ADMIN interface allows for wildcards (*), but use those with care.
If you’re a developer working on your own private rig, this won’t be a problem. If you’re in an IT managed database, you’ll probably need a DBA to set this up for you. I will say this only once, you probably should NOT be debugging in production.
Actually debugging
Once I click the debug button and select the IP address, it should start as fast as the network connection can be made. I haven’t cut out a delay or sped up the video here – that’s the actual runtime.
Step Over – go to the next line
Step Into – let’s open this unit and debug that
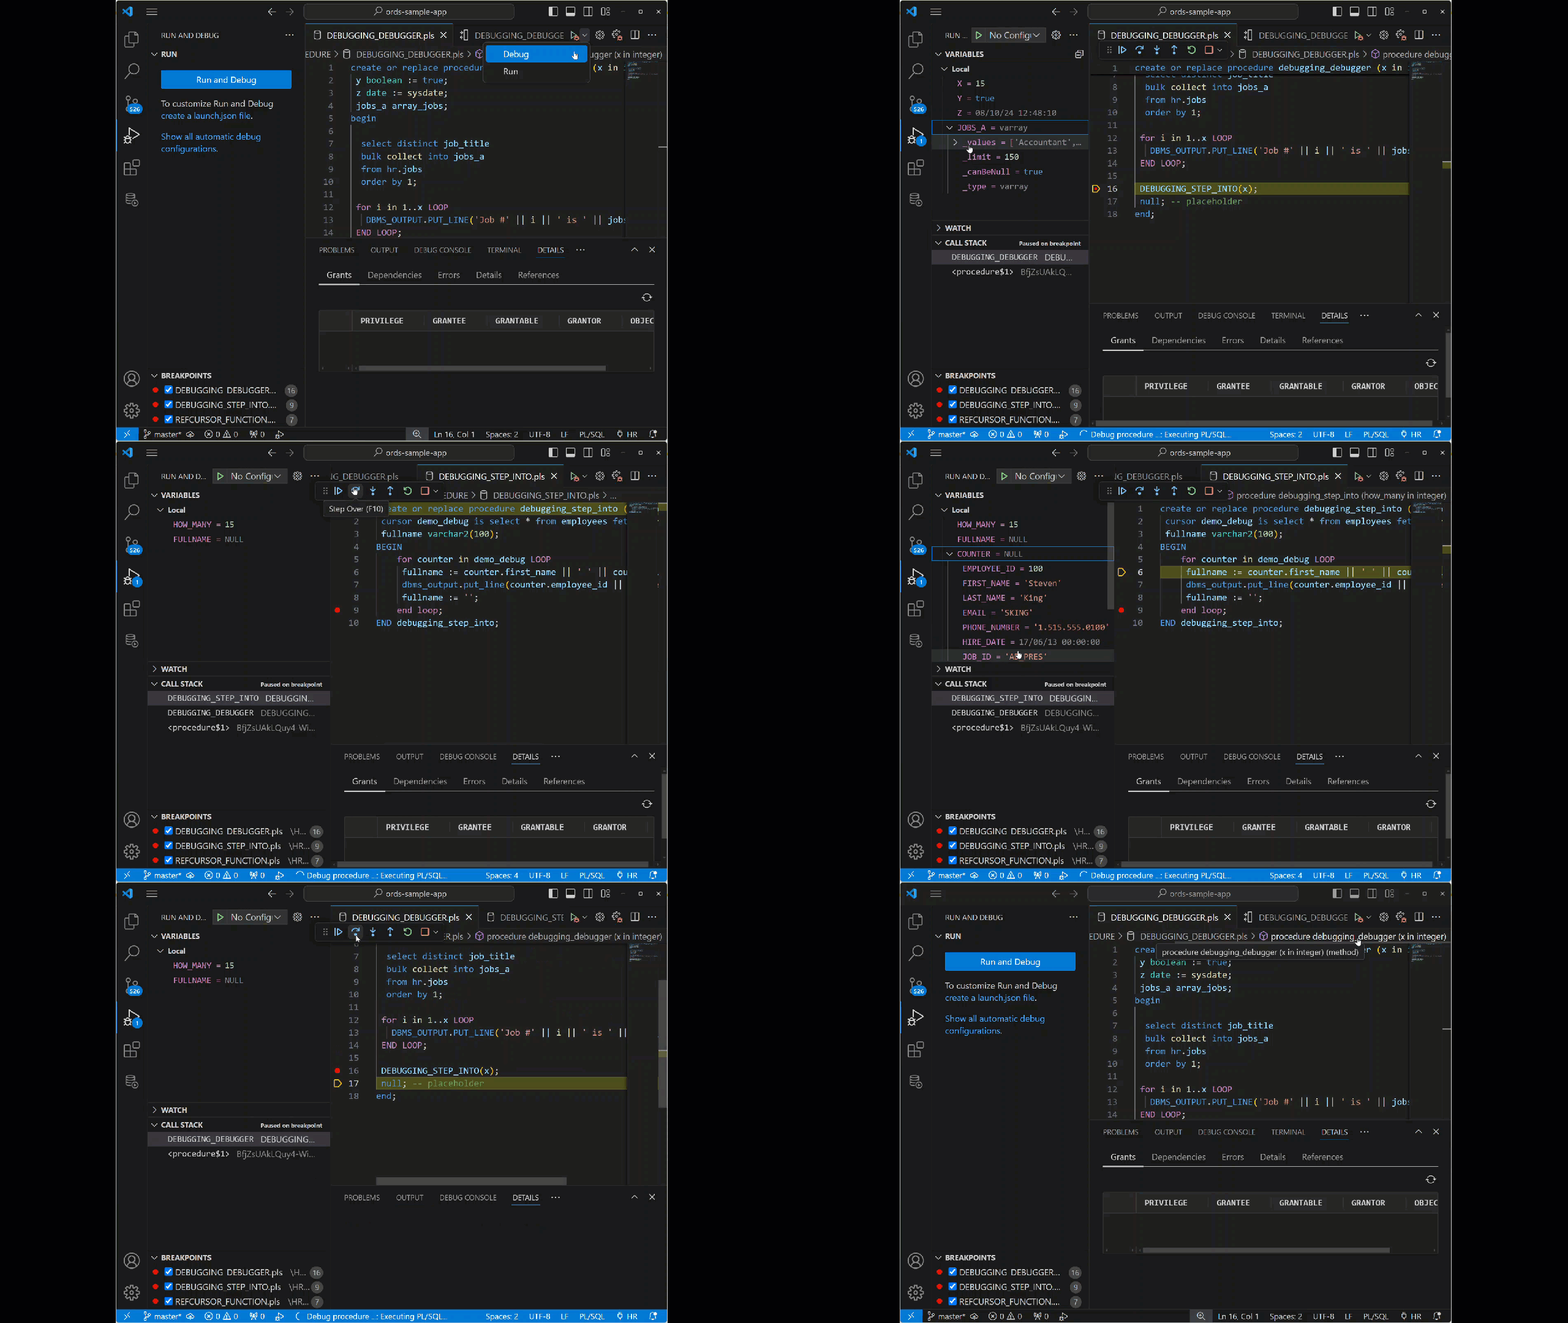
As we’re debugging we can observe the Call Stack being updated. And we can observe the Variable panel populating. The scalars X, Y, and I are all there, but so also is our CURSOR and ARRAY of strings from our user defined TYPE.
As you step into the 2nd program, DEBUGGING_STEP_INTO, you’ll see that the scope of the variables changes, so you’re just seeing the local program’s environment. As we step back out to the calling procedure, it will update again.
When it’s finished, the DBMS_OUTPUT is collected and shown in the script output panel.
Debugger Settings
You don’t have to be prompted before each debug session. If you’re coming off and on of VPN’s or Starbucks WiFi’s, you probably just want to keep this preference enabled.
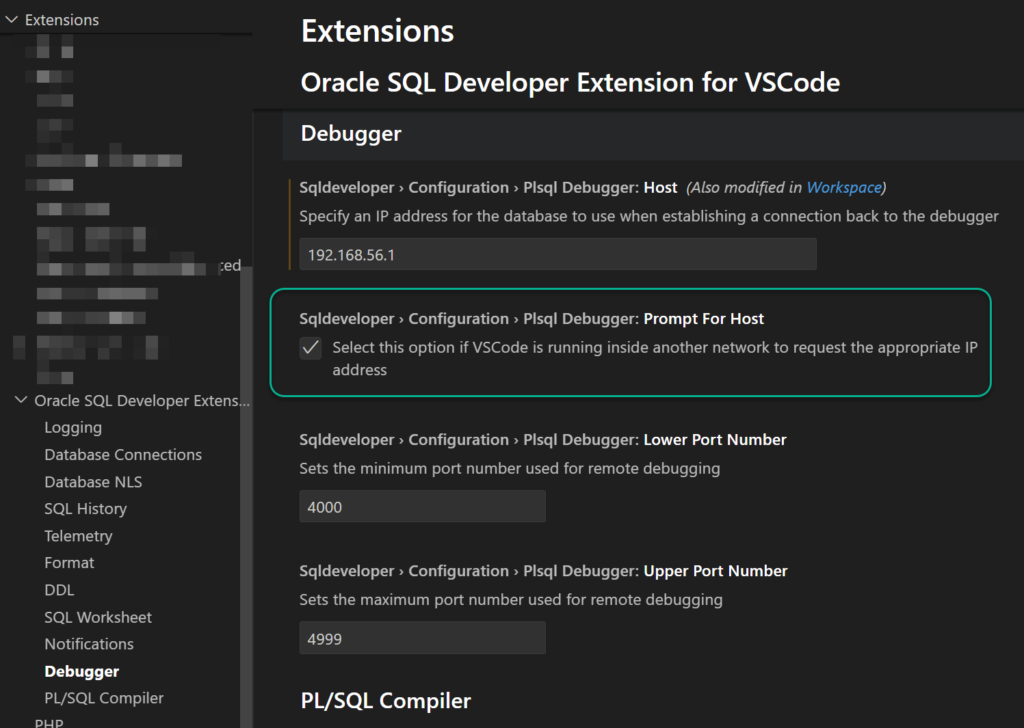
You can see you also have the ability to set the PORT range for debugging, so you can match up what’s been set in your database ACL.
Upcoming debugger features
- support for attaching to external processes (APEX apps!)
- standalone debugging of TYPEs
- Setting conditional breakpoints or pass counts
- Changing the values for our variables
These are all on the worklist to add in upcoming updates!
Upcoming VS Code features
We have in the hopper the following, but they just didn’t quite make the cut.
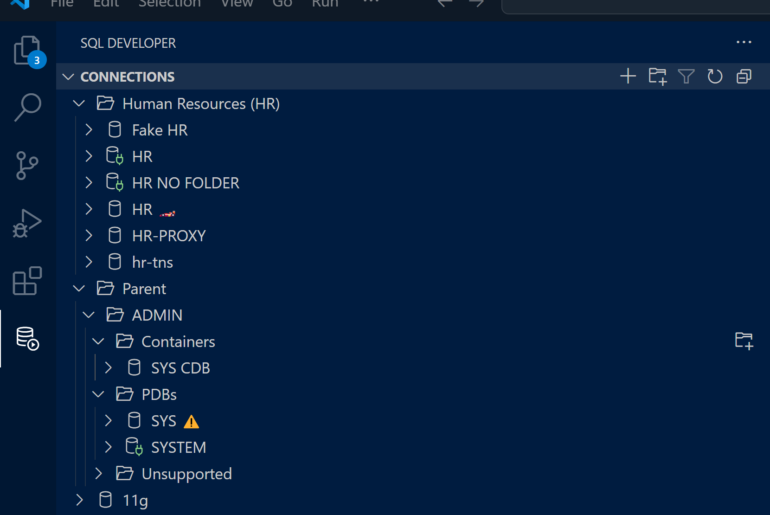
- Connection folders
- Reports
- Real Time SQL Monitoring
We should be able to deliver much of that before the calendar year ticks over to 2025.



14 Comments
Hi Jeff
Is it possible to debug as other user?
I’m getting error : No debugger available for this plsql object
When trying to run debug as privileged user.
It works fine when running as a object owner.
Cheers
Lukasz
Oh my, you’ve just uncovered a bug. Sorry about this, I’ve got it logged, but in the meantime you’ll need to login as that user or fall back to sqldev/classic.
DBTU-00001: Missing key: DBTU_04701_MESSAGE in resource: com/oracle/dbtools/server/dap/DapErrors
Is that a question?
I’m getting this error when debugging: Cannot invoke “com.oracle.dbtools.utils.core.web.common.WebURI$Path.toString()” because “contextRelativePath” is null
Need more details.
What are you debugging and is it from a file or from browsing the database?
Does the Run dialogue work from the same plsql program?
I have hit the same error. I encountered it both when opening debugger when having the file open from GIT or also from browsing the database.
The error appeared when starting the debugger session.
I have the same error
Who are you logged in as, what program are you trying to debug?
For example
I am logged in as HR and am trying to debug HR procedure XYZ…on an Oracle 23ai database.
was solved? com.oracle.dbtools.utils.core.web.common.WebURI$Path.toString()” because “contextRelativePath” is null?
Maybe? I never got a reproducible test case. 24.4.1 is the latest version, are you still seeing issues there? If so, I might ask for some logs.
Jeff – also couple more things.
1) pinning the resultset
2) refreshing the resultset
those two features are there in the Classic SQL Dev, those features will also be available in SQL Dev Next ?
….Connection folders…..
Thanks for that Jeff, very useful to Organize, when working with multiple databases
Stay tuned, and be patient, they’re coming.