Oracle SQL Developer Extension for VS Code.
Explain plans are nice. You don’t need to run the query or have a plan already available to see what or how your query might run.
And these have always been easy to get, either by literally running the ‘explain plan for’ SQL command or using our ‘plan button’ in the worksheet toolbar.
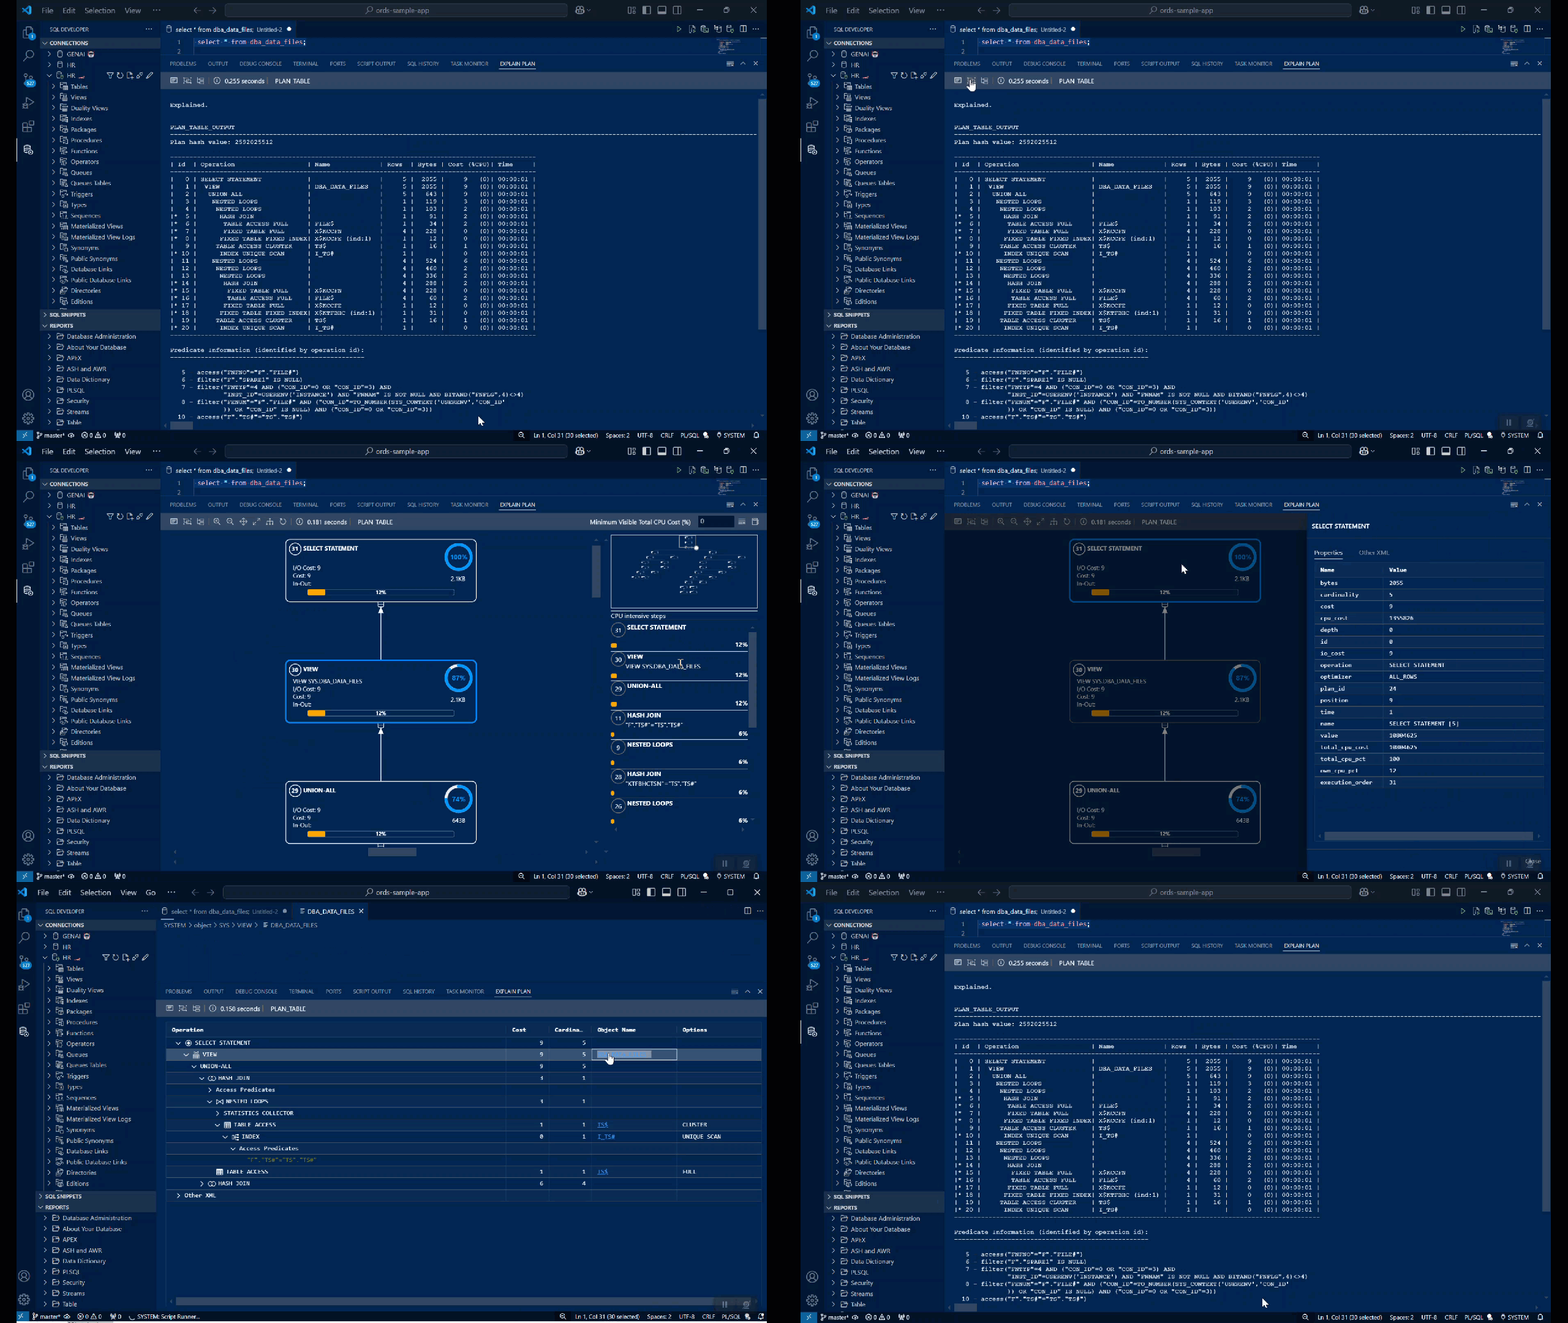
Available Plan Displays
You have three options for viewing plans:
- visual (diagrams)
- plain text
- grid/trees
Here’s a visualization, versus making you read more.
Cached or DBMS_XPLAN displays
This is a feature carried over from SQL Developer Classic.
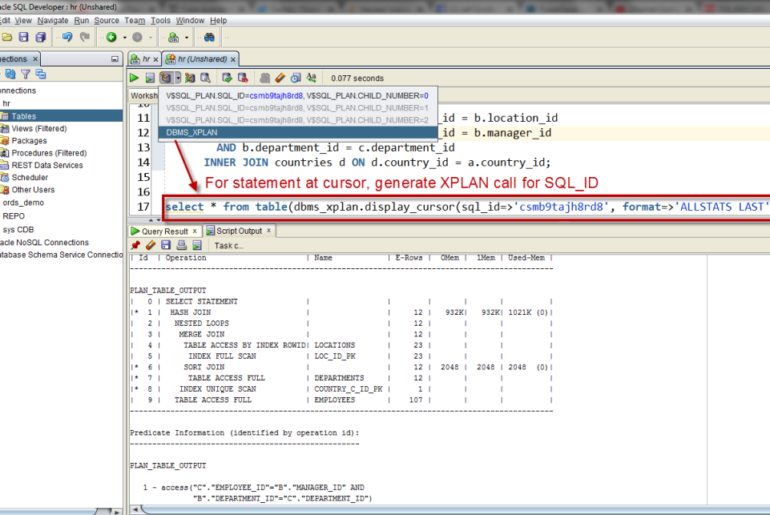
In 24.4 we introduced this same feature in our VS Code extension.

The first option is what you’ve already seen.
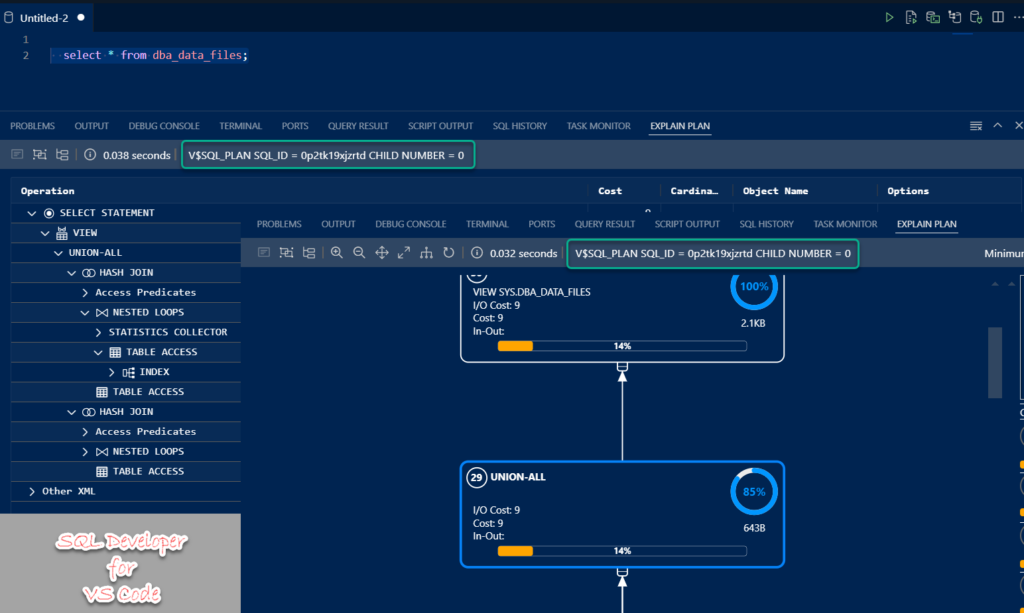
The next 3, V$SQL_PLAN…are where we compute the SQL_ID and offer to show 3 of the cached plans for that query. We don’t know if these are in the SGA or not, but if you’ve ran the query recently the first one should be available.
When you open one of these, you’ll see this distinction in the display:
What about the DBMS_XPLAN thing, what’s that do?
We just generate a query to call the PL/SQL api to get your SQL statement’s execution plan, like so –
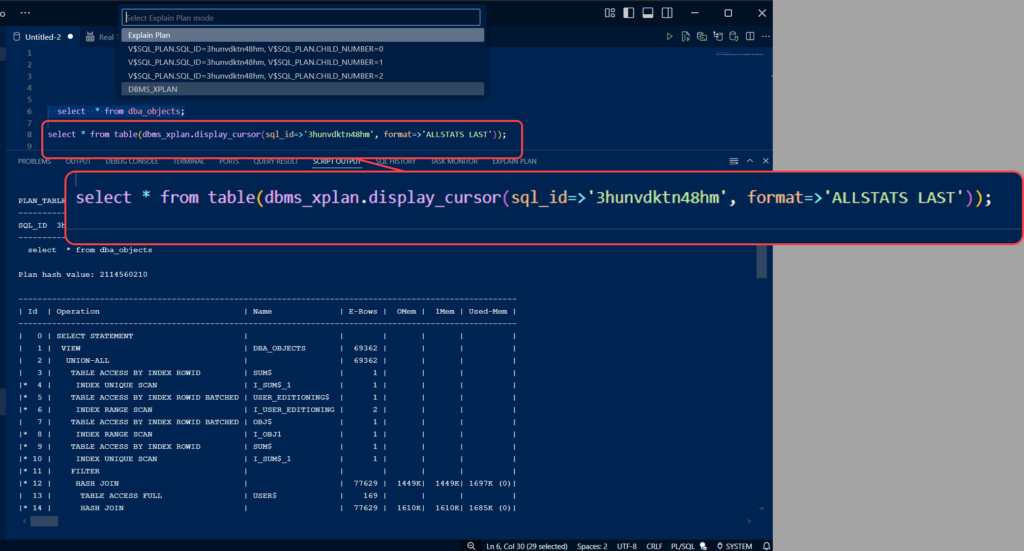
If you don’t like the ‘ALLSTATS LAST’ format, simply change it. We’re just trying to save you some typing.
What about seeing the plan, as it’s being executed?
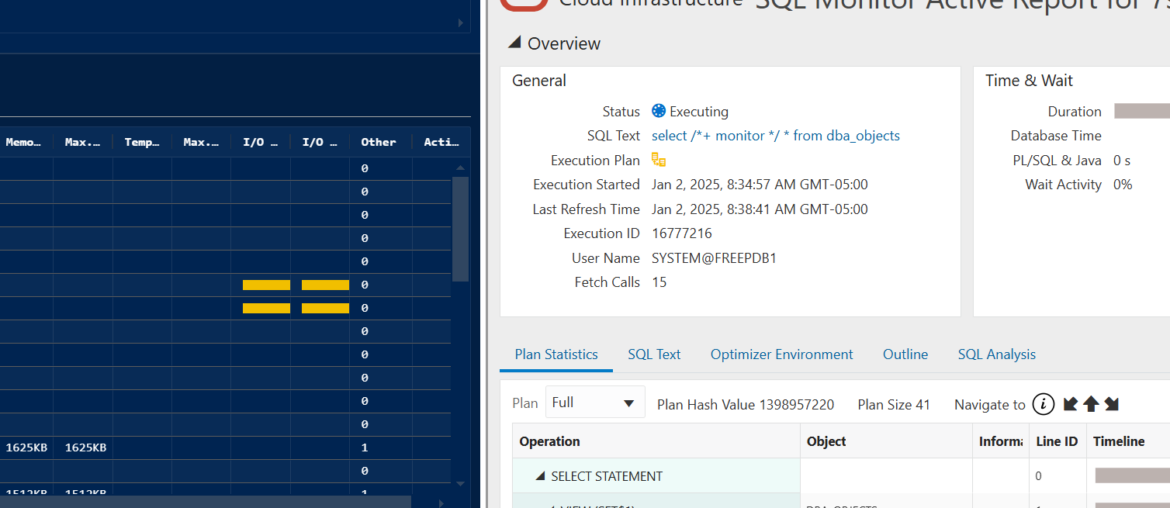
Yes, we have that feature in our Extension now as well. The database feature is called Real Time SQL Monitoring, or often just referred to as the ‘SQL Monitor’ feature.
If you right-click on your connection and select this, you’ll get the report for all available SQL Monitoring reports –
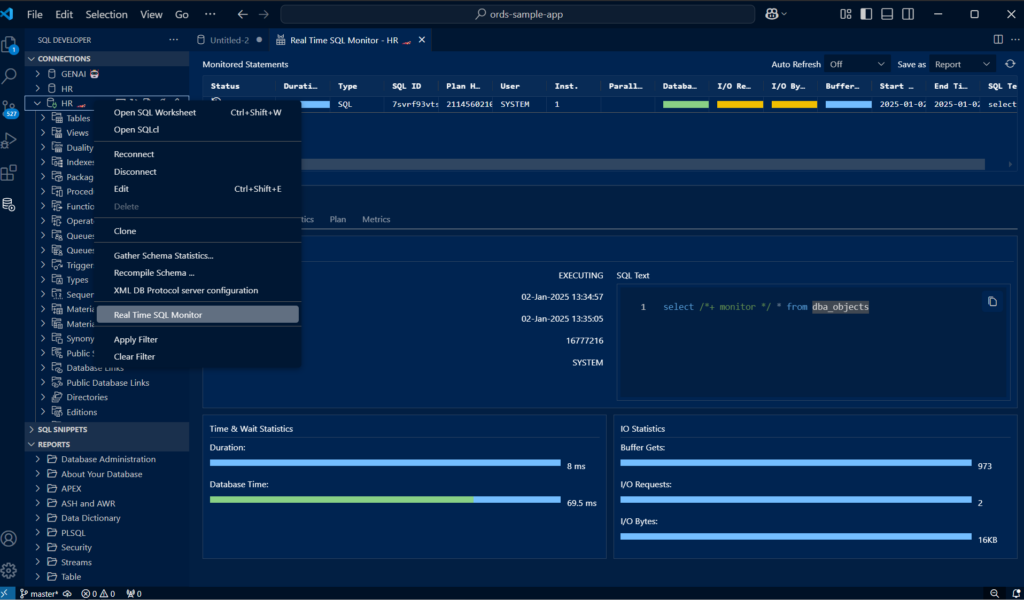
Now toggle over to the Plan page –
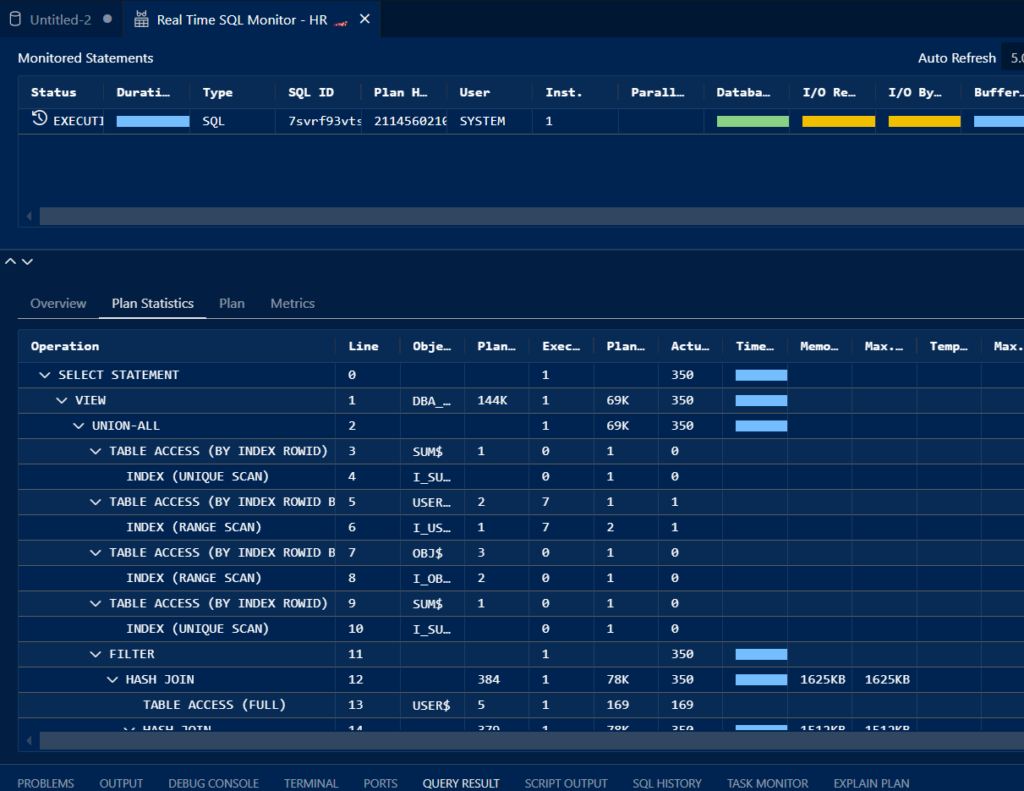
Note we will be adding sorting/filtering feature to the Monitoring report so you can more easily find your reports in our next update.
And yes, you can export the report so it can be shared –
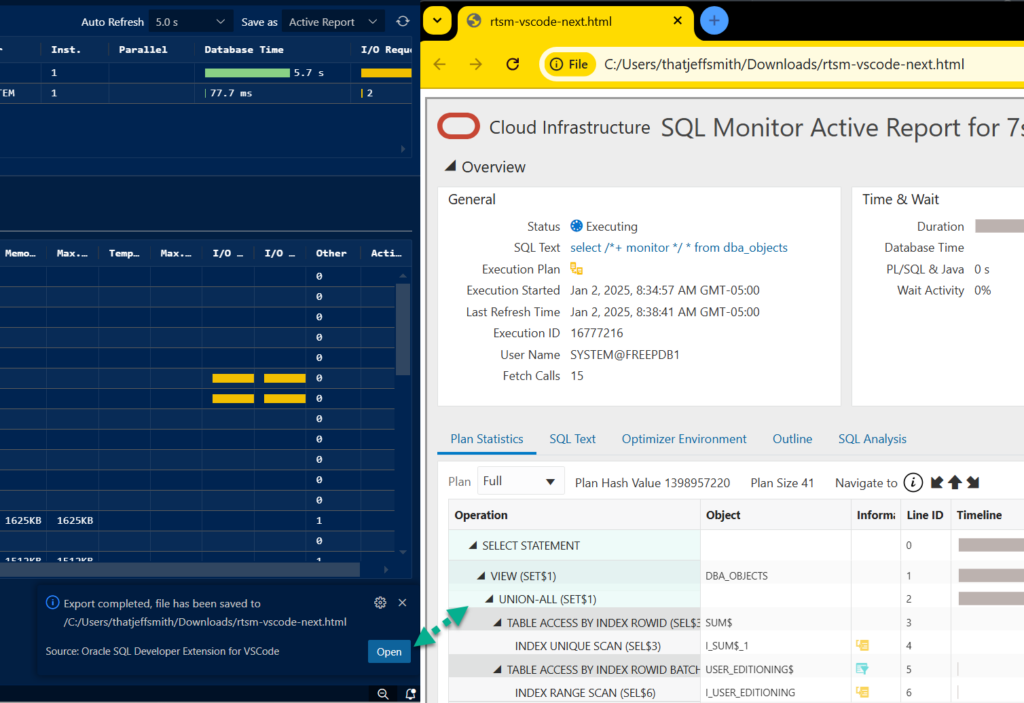
When does this feature, matter?
When you’re about to ask someone for help with why your query is ‘running so slow?’ These plans show what the database is doing to get your data.
Sometimes the optimizer makes less than perfect choices, and usually these bad plans are because of the way you wrote your query, or the statistics for your tables and indexes are missing or stale.
These plans help expose the problematic aspects of the optimizer’s path to getting your data, and usually will show where the ‘fix’ will be found and implemented.
I highly recommend Maria’s ‘how to read a plan’ post. She’s added a ton of great video tutorials to go along with it for maximum learning!


