This feature is going to be hard to cover in a single post, but I’m going to try anyway. The Reports interface received performance improvements, a few tweaks to make them easier to build, a slew of new charting options, and more visual control to tweak. Oh, it’s also available via the command-line interface.
Let’s cover the performance bit first.
The first time I try to open a report in ‘Edit’ mode in earlier versions, it can take almost 15 seconds for the thing to load. Ouch. Even though it’s faster on subsequent loads, that really isn’t acceptable. In version 4.0, the report editor should load in a second or two consistently.
Let’s Talk About Charts
In version 4.0, you don’t need to query a duplicate column just to get the chart to work anymore.
What do I mean? I mean to get a simple bar chart, I don’t need this anymore:
SELECT country,country, COUNT(*) FROM beer
GROUP BY country, country
HAVING COUNT(*) > 100
ORDER BY 3 DESC
Instead, I can JUST use this:
SELECT country, COUNT(*) FROM beer
GROUP BY country
HAVING COUNT(*) > 100
ORDER BY 2 DESC
You see, we need to know what to use the for the group, series, and value fields for charts. In version 4, we can assign the values from the available query columns manually. Less data to query, less I/O, and no need for you to think with your ‘SQL Developer Reports’ Hat on anymore – just concentrate on getting the data right.
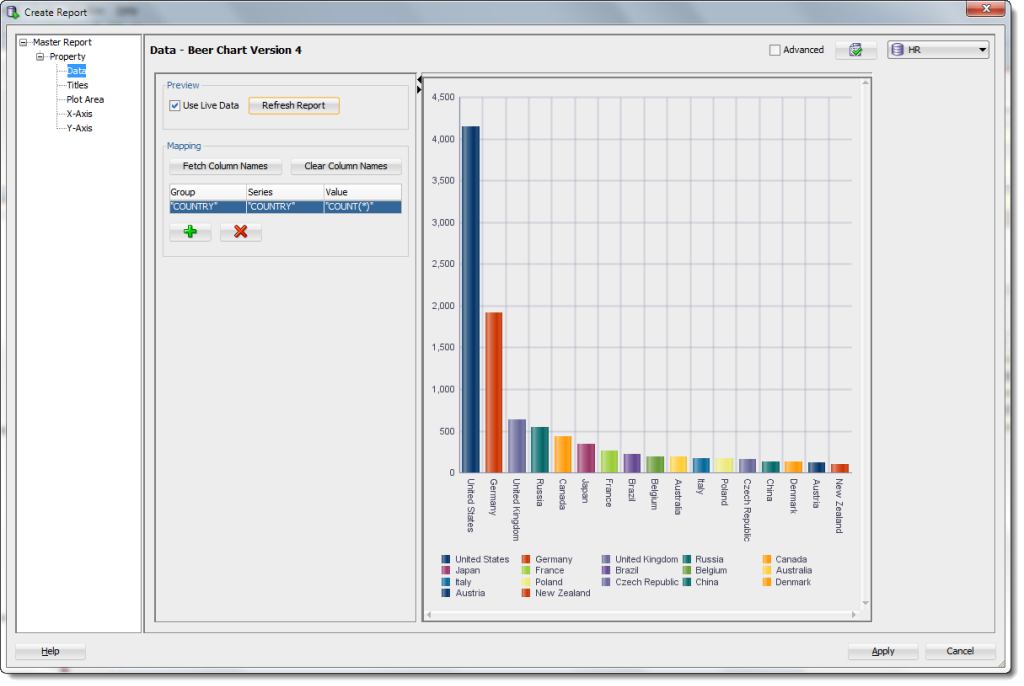
Oh, and don’t worry about this ‘breaking’ your old reports – they’ll still work in version 4.
Ok, now that I have the ‘pretty picture’ to reference, let’s talk about the ability to preview the charts.
Live Preview Your Chart
Let’s assign a connection for our report while we’re in design mode. This only makes it easier to test your report, it doesn’t physically tie the report for a particular database going forward.
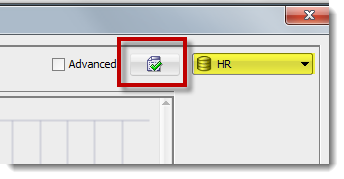
So in the upper right hand corner of the report editor, toggle that on and select your connection.
Then, look back over to the far left.
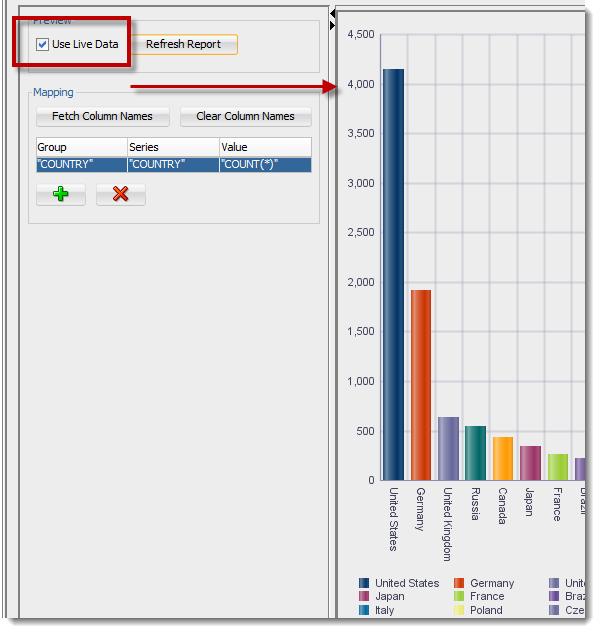
This ability to see what the chart will look like at run-time is reason enough to upgrade to SQL Developer version 4.0 all by itself – assuming you use our reports of course. No more setting it up, saving, closing, and running the report to see what will happen. Now you can leave your report design feeling pretty confident how it’s going to look when you run it.
This will also make it MUCH easier for you to experiment with our new types of charts.
There’s a LOT of new charts in version 4.
Like, more than 50. I can’t talk about all of them. But what I CAN do is show them all to you. Kinda. Check it out:
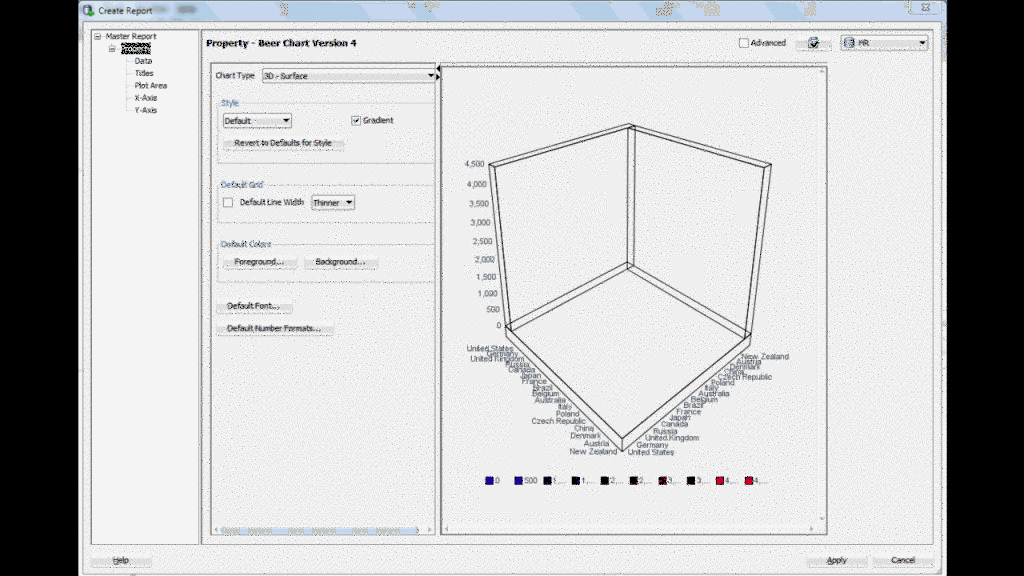
One last thing on the new charts – we’ll have some additional documentation for each chart type soon.
There’s quite a bit more you can do visually in the chart design. I can add titles, control the font, coloring, etc of that and the labels, etc. It’s pretty straightforward to start using, so I’ll end here and let you ask me the stuff you CAN’T figure out.



23 Comments
I’m still missing examples how to set up a “Hi-Lo-Close” Report or a “Combination”, what do I have to set for Dual/Dual Y reports, …?
A lot of different types are available but features without documentation are mostly useless.
Perhaps that’s why reports are among “Three (3) Things You’re Not Using But Totally Should Be” 🙂
I’ve not had the time to build them, but here are the docs/examples
Hi Jeff,
Please let me know if we could generate multiple reports in a single pdf document. Is there any way to exports all parent and child reports in a single pdf doc?
Thanks,
I know it will work for an HTML report, haven’t tried for PDF. have you?
Jeff,
Any way to automatically email the SQL Dev report (results only – not the query) to an end-user using SQL dev?
I’d probably use a database job to to that. Or use a reporting solution. You could setup a command-line interface job run and built a .bat or .sh script to take the output and email to to your end-user. Or build an APEX app. Or, or, or…
Yeah – knew that. Long story behind why I asked, though. I’ll save it for Kscope16 🙂
Are those report charts work in the latest developer 4.x? when can we have the documentation for those chart specs, for example, an example sql query or data specs for a given chart like bubble, etc. would be very useful.
Can we replace our old oracle discoverer 9i with sql developer reporting, we are using discoverer to generate SQL reports, now oracle is not supporting it & we are looking for better BI/Datawarehouse reporting option.
No…but you also need to remember that reports in SQL Developer are more of an ad hoc system for the average database user. We’re not a production reporting solution.
But, if you really wanted to, you could look at the XML format of one of our reports and see if you can get a discoverer 9i report out in that format.
Hi,
Do you have an example of chart “Stock – Open-Hi-Lo-Close Candle” or similar?
Regards,
Ricardo Cesar
Hi jeff,
I want to generate a html report of all the procedures and function Schema “Test Run on codecoverage ” report. that is commad line and UI Mode.
EDIT – please remove this line and my previous comment
No. The report is documenting the count of transactions (vertical axis) that take certain number of seconds (horizontal axis) by category.
Here’s my SQL:
WITH xa_durations AS
(SELECT xa_id, xa_type, MAX(xa_ts) – MIN(xa_ts) AS DUR,
TRUNC(EXTRACT (SECOND FROM (MAX(xa_ts)-MIN(xa_ts)))) DELTA_GROUP
FROM xa_log
WHERE xa_date BETWEEN to_date(:earliest_date,’mm/dd/yyyy’) AND to_date(:latest_date,’mm/dd/yyyy’)
AND xa_type IS NOT NULL
GROUP BY xa_id, inf_nm
ORDER BY xa_id DESC
)
SELECT delta_group, xa_type, COUNT(*)
FROM xa_durations
GROUP BY delta_group, xa_type
ORDER BY delta_group ASC, xa_type ASC
Jeff, is there a way to include bind variables in a chart title? For instance, if the data in the query is being selected by a date range, it would be important to show that on the chart, lest it be misinterpreted as all-inclusive.
I don’t think so…but I’m betting there’s another way to encompass that info in the report somehow. Are you not showing the date range in the chart on the axis?
No. The report is documenting the count of transactions (vertical axis) that take certain number of seconds (horizontal axis) by category.
Here’s my SQL:
WITH xa_durations AS
(SELECT xa_id, xa_type, MAX(xa_ts) – MIN(xa_ts) AS DUR,
TRUNC(EXTRACT (SECOND FROM (MAX(xa_ts)-MIN(xa_ts)))) DELTA_GROUP
FROM xa_log
WHERE xa_date BETWEEN to_date(:earliest_date,’mm/dd/yyyy’) AND to_date(:latest_date,’mm/dd/yyyy’)
AND xa_type IS NOT NULL
GROUP BY xa_id, inf_nm
ORDER BY xa_id DESC
)
SELECT delta_group, , COUNT(*)
FROM xa_durations
GROUP BY delta_group, xa_type
ORDER BY delta_group ASC, xa_type ASC
Is the HTML chart output size able to be modified? Semms like my chart Axis ID’s are being cut off.
Does it render OK in SQL Developer, but not when you send it to HTML? If so, that sounds like a bug.
Another great post Jeff. It uncovered an issue though for me in SQL Dev 4. I’m running a desktop resolution of 1366×768 on my laptop and when I open a new report window it is vertically too large for my screen. That means the ‘Apply’ button is off the bottom of the screen and no amount of dragging or attempting to resize the window will let me see the buttons.
Bugged!
Now, what can we do about getting you a nicer monitor/video card?
Ha Ha. Don’t worry too much Jeff, it’s only on my laptop I noticed the issue! My desktop is much nicer. That said, if Oracle want to start providing a 29″ widescreen monitor with every SQL Developer 4.0 download I won’t say no 😉
I have the same issue. Hopefully this is going to be fixed in the next version.
Jari & James – it’s fixed. In the next build the window is resizable so you can squeeze it down to fit.